Buyers Guides: Complete Shopping Decision Framework
Buyers guides that actually convert follow a five-step framework: define the purchase context, build a comparison matrix, weight criteria, score options, and validate margins.

Buyers Guides: Complete Shopping Decision Framework
Buyers guides that actually convert follow a five-step framework: define the purchase context, build a comparison matrix, weight criteria, score options, and validate margins. This tutorial walks you through building one from scratch in under two hours, with a scored template you can reuse across every product category in your store.
Before You Start
You need four things ready before Step 1: a product category with at least three comparable options (your product plus two or more competitors), access to your product cost data including landed cost and shipping, a spreadsheet tool (Google Sheets works fine), and 90–120 minutes of uninterrupted work time.
You should also have your store's margin targets on hand. If you haven't established those yet, work through calculating your profit margins first, the buyers guide framework depends on knowing your floor.
Knowledge level: intermediate. You should understand basic ecommerce metrics (AOV, conversion rate, margin percentage) and have at least one product live or ready to launch.
Step 1, Map the Purchase Context
The goal here is to identify exactly where your customer sits in their decision process and what type of comparison they need. Content Workshop's research on guide structure recommends that teams "start every guide with a detailed outline that aligns the content to buyer needs and campaign goals," and that alignment begins with understanding the purchase context.
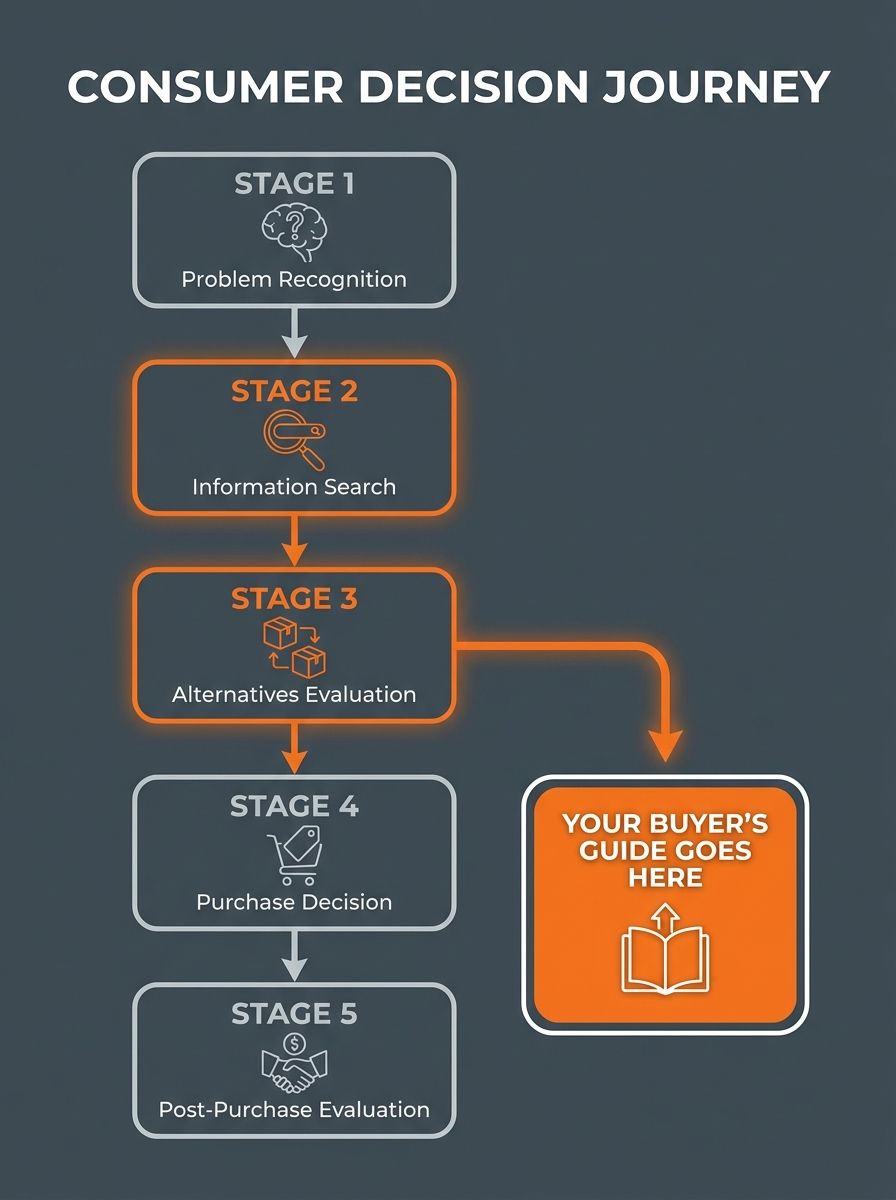
The consumer decision process runs through five stages: problem recognition, information search, evaluation of alternatives, purchase, and post-purchase behavior. Your buyers guide targets stages two and three. As Yotpo's breakdown of the consumer decision-making process defines it, stage two is when "customers want to find out their options," while stage three is when a customer compares those options to make a final choice. A guide aimed at stage-two shoppers needs broad category education. A guide aimed at stage-three shoppers needs direct, feature-level comparison.
Action: Open your spreadsheet. In cell A1, write the product category. In A2, write "Stage 2" or "Stage 3" based on where your target customer likely enters. In A3, list the primary purchase trigger (price sensitivity, feature confusion, trust gap, or quality uncertainty).
Verification: You know this step worked when you can complete this sentence without hedging: "My customer arrives at this guide because they need help with [specific trigger] while comparing [specific category]."
Step 2, Build the Comparison Matrix
A structured comparison matrix lets buyers evaluate products directly, making differences visible at a glance. According to Creately's product comparison research, structured templates "help ensure you don't miss important details or make mistakes, keeping your comparison" accurate and consistent across every product you include.
Your matrix needs 4–6 criteria across the top and 3–5 products down the left side. Fewer than four criteria looks shallow. More than six creates decision fatigue, 75% of consumers already expect personalized, filtered experiences, so overloading them with 8 or 10 data points backfires.
Here's what a basic matrix looks like for a dropshipping product category:
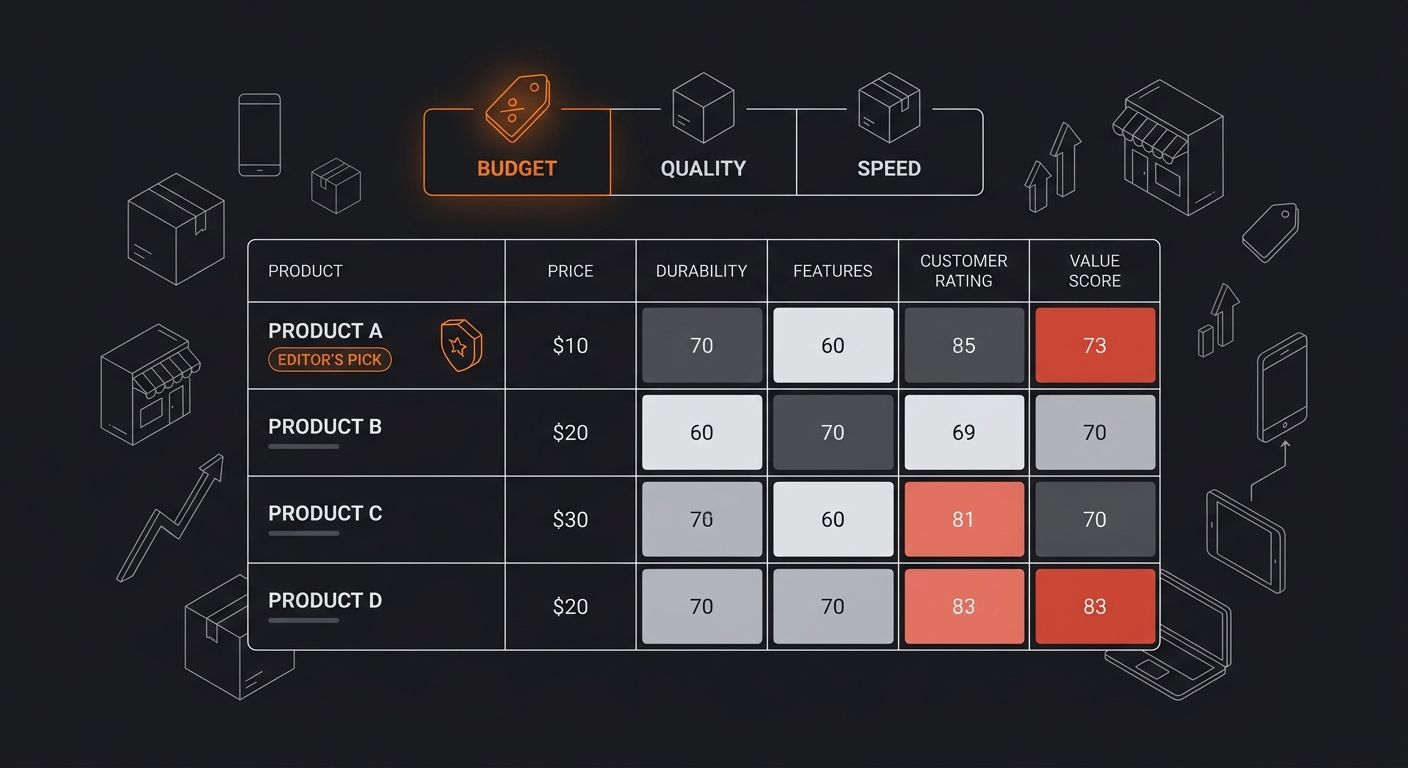
Criteria | Product A (Yours) | Product B | Product C | Product D |
|---|---|---|---|---|
Price Range | $24.99 | $29.99 | $19.99 | $27.50 |
Shipping Speed | 7–12 days | 3–5 days | 15–25 days | 5–8 days |
Return Policy | 30-day free | 14-day paid | No returns | 30-day free |
Material Quality | 4/5 | 3/5 | 2/5 | 4/5 |
Customer Rating | 4.6 stars | 4.2 stars | 3.8 stars | 4.4 stars |
Warranty | 1 year | 90 days | None | 6 months |
Action: Create this table in your spreadsheet. Fill in real data for every cell. If you're sourcing from multiple suppliers, pull actual cost breakdowns, the research from category-based supplier guides gives you benchmarks for realistic shipping times and quality tiers.
Verification: Every cell contains a specific number, date range, or rating. Zero cells say "varies" or "depends." If any cell is vague, you don't have enough data yet.
Step 3, Weight Criteria by Customer Intent
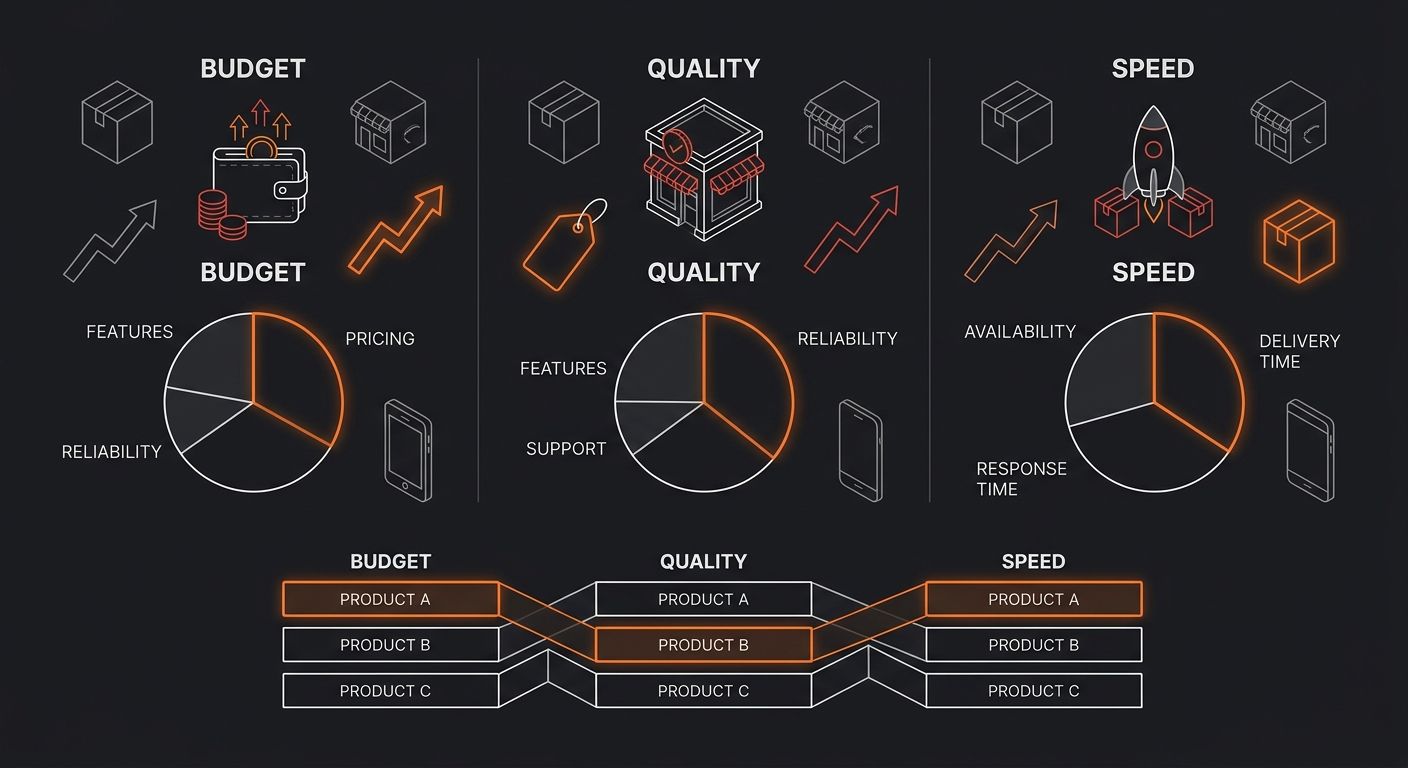
Not every criterion matters equally to every buyer. A price-sensitive customer weights cost at 40% and shipping speed at 15%. A time-sensitive buyer flips those numbers. Your buyers guide needs to acknowledge this explicitly, and the best guides let readers self-select their priority.
Content Workshop recommends that effective guides "offer frameworks or prompts to weigh competing priorities", speed vs. cost, quality vs. availability. This step builds that in.
Action: Add a "Weight" row to your matrix. Assign percentage weights that total 100%. Create two or three weight profiles based on your customer segments:
Budget Buyer: Price 40%, Shipping 15%, Returns 15%, Quality 20%, Rating 5%, Warranty 5%
Quality Buyer: Price 15%, Shipping 10%, Returns 10%, Quality 35%, Rating 20%, Warranty 10%
Speed Buyer: Price 20%, Shipping 35%, Returns 15%, Quality 15%, Rating 10%, Warranty 5%
Verification: Your weights total exactly 100% for each profile. And here's the real test: when you apply the Budget Buyer weights, the ranking order should differ from the Quality Buyer ranking. If every profile produces the same ranking, your criteria aren't differentiated enough, you need to swap at least one generic criterion for something more specific.
Step 4, Score and Add Visual Hierarchy
Art of Procurement's buyers guide framework specifies that each guide should contain "essential criteria when selecting a solution, common mistakes to avoid, and latest trends." The most common mistake at this stage is skipping standardized scoring and relying on adjective-heavy descriptions that give readers nothing to compare.
Action: Score each product on each criterion using a 1–5 scale. Multiply each score by the weight percentage for each buyer profile. Sum the weighted scores per product per profile.
Example calculation for Product A under the Budget Buyer profile:
Price: 4 × 0.40 = 1.60
Shipping: 3 × 0.15 = 0.45
Returns: 5 × 0.15 = 0.75
Quality: 4 × 0.20 = 0.80
Rating: 5 × 0.05 = 0.25
Warranty: 4 × 0.05 = 0.20
Total: 4.05 / 5.00
Do this for every product across every buyer profile. For the published guide, translate these scores into visual hierarchy: color coding (green/yellow/red), star ratings, or progress bars. Don't make readers parse raw decimals. Research shows 61% of consumers are more likely to return to sites that offer tailored, filterable interactions, so building in profile-switching functionality pays for itself in repeat visits.
Verification: You have a clear #1 recommendation for each buyer profile, and you can articulate in one sentence why that product wins for that specific profile type.
Step 5, Validate the Margin Math
This step separates buyers guides that drive revenue from guides that accidentally push customers toward your lowest-margin SKU. Before publishing, run every recommended product through your margin calculator.
Action: For each product that ranks #1 in any buyer profile, document:
Product cost (including landed cost, packaging, and DDP shipping if applicable)
Your selling price
Gross margin percentage
Contribution margin after ad spend
If your recommended product for the Budget Buyer profile carries a 12% margin while your Quality Buyer recommendation carries a 45% margin, you need to redesign the guide's visual emphasis. The Budget recommendation stays, removing it destroys trust, but the Quality recommendation gets the hero position, the larger image, the "Editor's Pick" badge.
This is where understanding your platform costs matters. A product with a 30% gross margin on Shopify (with its 2.9% + $0.30 transaction fee on the basic plan) looks different than the same product on WooCommerce with Stripe at the same rate structure, because your monthly fixed costs and app fees shift the contribution margin.
Verification: Every #1-ranked product carries at least your minimum acceptable margin. If it doesn't, adjust the guide's visual hierarchy (not the scores) so the higher-margin recommendation gets more prominent placement.
Common Failures and How to Spot Them
Problem 1: Every product gets the same score. Your criteria are too broad or your scoring is too generous. Fix it by replacing generic criteria ("quality") with specific, measurable ones ("thread count," "warranty length in months," "defect rate per 100 units"). If you're vetting suppliers alongside products, the supplier scorecard framework gives you the granular criteria you need.
Problem 2: The guide recommends your competitor's product. This happens when you set criteria honestly and a competitor genuinely wins. You have two options: improve your product's weak spots, or adjust your criteria selection to emphasize areas where your product legitimately leads. Don't manipulate scores. Readers spot rigged guides immediately, and trust destruction kills repeat purchase rates.
Problem 3: Conversion rate drops after publishing the guide. Usually caused by decision paralysis from too many options. Cut your comparison from 5+ products down to 3–4. Research on consumer decision-making confirms that observing actual behavior in context reveals more choices often produce fewer purchases.
Where to Go From Here
The framework above produces a single buyers guide for one product category. The next move is scaling it across your catalog. Duplicate your scored spreadsheet template for each category, adjusting criteria and weights to match the specific purchase context, a home textiles guide uses different criteria (material, thread count, wash durability) than an electronics guide (battery life, compatibility, warranty length).
Once you have three or four guides live, track two numbers: time on page and conversion rate from guide visitors versus non-guide visitors. Those two metrics tell you whether your comparison framework is moving purchase decisions or inflating your content volume without driving revenue. The guides that perform best get updated quarterly with fresh pricing data and any new competitor entries. Stale buyers guides with outdated prices erode trust faster than having no guide at all, and if a reader catches a wrong price, every other number on the page becomes suspect.

Ryan Torres
Ryan Torres is a former Amazon FBA seller turned dropshipping consultant who has generated over $2.8M in ecommerce revenue across 14 product launches. He specializes in supplier vetting, margin optimization, and scaling DTC operations for sub-$1M brands. Ryan focuses on actionable frameworks that drive measurable results for independent operators.
Frequently Asked Questions
- How long does it take to build a buyers guide?
- A complete buyers guide using this framework takes about 90–120 minutes to build the first time, though the framework is designed to be reusable across product categories in your store.
- How many comparison criteria should a buyers guide include?
- A buyers guide should include 4–6 criteria; fewer than four looks shallow while more than six creates decision fatigue and reduces conversions.
- What are the five steps to create a high-converting buyers guide?
- The five steps are: map the purchase context, build a comparison matrix, weight criteria by customer intent, score and add visual hierarchy, and validate the margin math before publishing.
- Should a buyers guide recommend a competitor's product?
- If a competitor genuinely wins based on honest criteria and scoring, the guide should recommend it; manipulating scores to favor your product destroys reader trust and reduces repeat purchases.
- How should I assign weights to different criteria in a buyers guide?
- Create 2–3 weight profiles based on customer segments (e.g., Budget Buyer, Quality Buyer, Speed Buyer) and assign percentage weights that total 100%, ensuring different profiles produce different product rankings.
- Why is margin validation important for buyers guides?
- A guide that recommends your lowest-margin product can lose you money with every conversion; validate that top-ranked products meet your minimum acceptable margin, and adjust visual hierarchy (not scores) to emphasize higher-margin recommendations.
- What data do I need before starting to build a buyers guide?
- You need a product category with at least three comparable options, access to your product cost data including landed cost and shipping, a spreadsheet tool, 90–120 minutes of uninterrupted time, and your store's margin targets.
- How should I prevent decision paralysis in a buyers guide?
- Limit your comparison to 3–4 products instead of 5 or more, as research shows too many options often produce fewer purchases and lower conversion rates.
Related Articles

Product Research Surveys: Complete Guide
By the end of this guide, you'll know how to build and deploy a product research survey that returns data specific enough to drive SKU-level decisions. The whole process takes about 3-4 hours for your first survey, faster every time after that.
Product Description Red Flags: Why Generic Manufacturer Copy Tanked Your Conversion Rate
"Premium quality material, comfortable to wear, suitable for all occasions, perfect gift for friends and family." That exact sentence, with minor word-order variations, appears across thousands of AliExpress product listings in jewelry, apparel, and home décor.

User Guides Template: Create Better Documentation
The six-section user guides template that ships with every major documentation platform organizes information by product structure, not by user problem.
Explore more topics