The Supplier Scorecard Audit: Building a Quality Matrix That Catches Red Flags Before Your First 100 Orders
Procurement scoring frameworks use a 0-100 scale where any supplier below 60 earns "red" status, meaning business on hold and corrective action required.

The Supplier Scorecard Audit: Building a Quality Matrix That Catches Red Flags Before Your First 100 Orders
Procurement scoring frameworks use a 0-100 scale where any supplier below 60 earns "red" status, meaning business on hold and corrective action required. Applying this same threshold structure to dropshipping supplier vetting across five weighted dimensions catches the quality failures that platform star ratings average into false confidence.
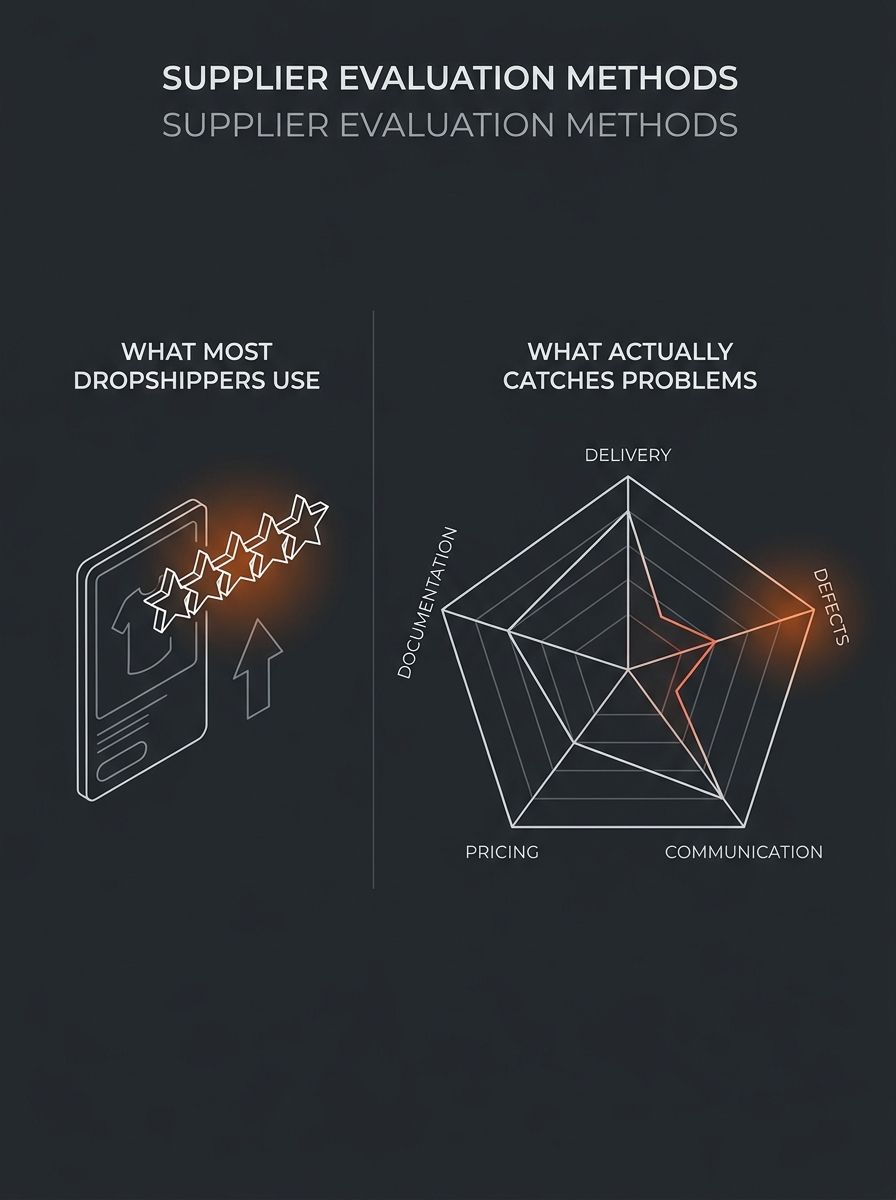
Platform Ratings Measure Volume, Not Quality
DSers, Spocket, and Zendrop surface supplier scores derived from listing age, total order count, and aggregate star ratings. None of these data points tell you whether a supplier ships within their stated lead time, packages products to survive international transit, or responds to quality complaints within 48 hours. A supplier with 50,000 lifetime orders and a 4.7-star rating can still carry a 12% defect rate on the specific SKU you're sourcing. The volume masks the variance.
The procurement world solved this problem decades ago. The 7 Cs framework evaluates suppliers across competence, capacity, commitment, control, cash, cost, and consistency, giving enterprise buyers a structured vocabulary for supplier performance metrics that goes far beyond order count. Dropshippers need a stripped-down version of this approach, adapted for smaller volumes and the specific risks of cross-border fulfillment.
As we've covered in our breakdown of why automation tools hide quality red flags, the tools most dropshippers rely on for supplier selection are designed to surface high-volume suppliers, not high-quality ones. The scorecard below fixes that misalignment.
The Five-Dimension Dropshipping Scorecard
Why five dimensions instead of seven? Because dropshippers don't have procurement teams, and a supplier quality scorecard you won't fill out is worse than no scorecard at all. This framework collapses the 7 Cs into five measurable dimensions a solo operator can evaluate with sample orders and documented communication. Call it the 5D Supplier Score: delivery, defects, dialogue, dollars, and documents.
Dimension 1: On-Time Delivery Rate. Track the percentage of orders shipped within the supplier's stated processing window. Gardner Intelligence benchmarking data found that top-performing manufacturers achieve 96% on-time delivery rates through standardized measurement across all departments and shifts. Your target for a dropshipping supplier should be 90% or above on a sample of 10-20 test orders. Below 80% is an automatic fail.
Dimension 2: Defect and Return Rate. Order 5-10 units of each SKU you plan to sell. Document every defect: wrong color, damaged packaging, missing components, quality inconsistencies between units. Enterprise procurement tracks this as PPM (non-conforming parts per million), but at dropshipping scale, you're working with percentages. A defect rate above 5% on your sample batch should score below 40 on the 0-100 scale.
Dimension 3: Communication Responsiveness. Send three types of messages at different times: a pre-order product question, a mid-fulfillment status request, and a post-delivery complaint about a real or simulated issue. Record response times. Suppliers who take longer than 48 hours on any message, or who give vague non-answers, score below 50. ForthSource's evaluation of supplier red flags identifies poor communication as one of eight warning signs that predict supplier failure, alongside unrealistically low prices, missing business credentials, and absence of quality control standards.
Dimension 4: Pricing Transparency. Does the supplier's quoted price include packaging? Does it match what you're actually charged? Are there hidden fees that appear after order confirmation? Lasso's analysis of underperforming suppliers flags lack of pricing transparency as a leading red flag, alongside financial instability and failure to meet KPIs. Any supplier who can't provide a fully-loaded unit cost in writing before you place an order scores zero here.
Dimension 5: Documentation Completeness. Can the supplier provide business registration, product certifications, material safety data sheets (where applicable), and clear shipping terms? Inventory Source's supplier evaluation guidelines state that "a documentation-first approach strengthens the supplier vetting checklist and provides defensible evidence during audits, disputes, or platform reviews." This dimension matters especially if you're selling into the EU after the July duty changes, where compliance documentation requirements tightened with the €3 per-item fee.
Weighting, Thresholds, and the Composite Score
Every dimension carries different weight depending on your business model. A store selling $15 impulse-buy accessories tolerates higher defect rates (refund costs are low) but cannot tolerate slow shipping. A store selling $80 home goods needs near-zero defect rates because each return wrecks margin.
Here's a starting-point weighting for a typical mid-AOV ($25-$50) dropshipping store:
Dimension | Weight | Green (≥80) | Yellow (60-79) | Red (<60) |
|---|---|---|---|---|
On-Time Delivery | 30% | ≥90% ship on time | 80-89% on time | <80% on time |
Defect Rate | 25% | <2% defect rate on sample | 2-5% defect rate | >5% defect rate |
Communication | 20% | <24hr avg response, clear answers | 24-48hr response | >48hr or vague |
Pricing Transparency | 15% | Full cost breakdown upfront | Minor discrepancies (<3%) | Hidden fees or >3% gap |
Documentation | 10% | All requested docs provided | Missing 1-2 non-critical docs | Missing registration or certs |
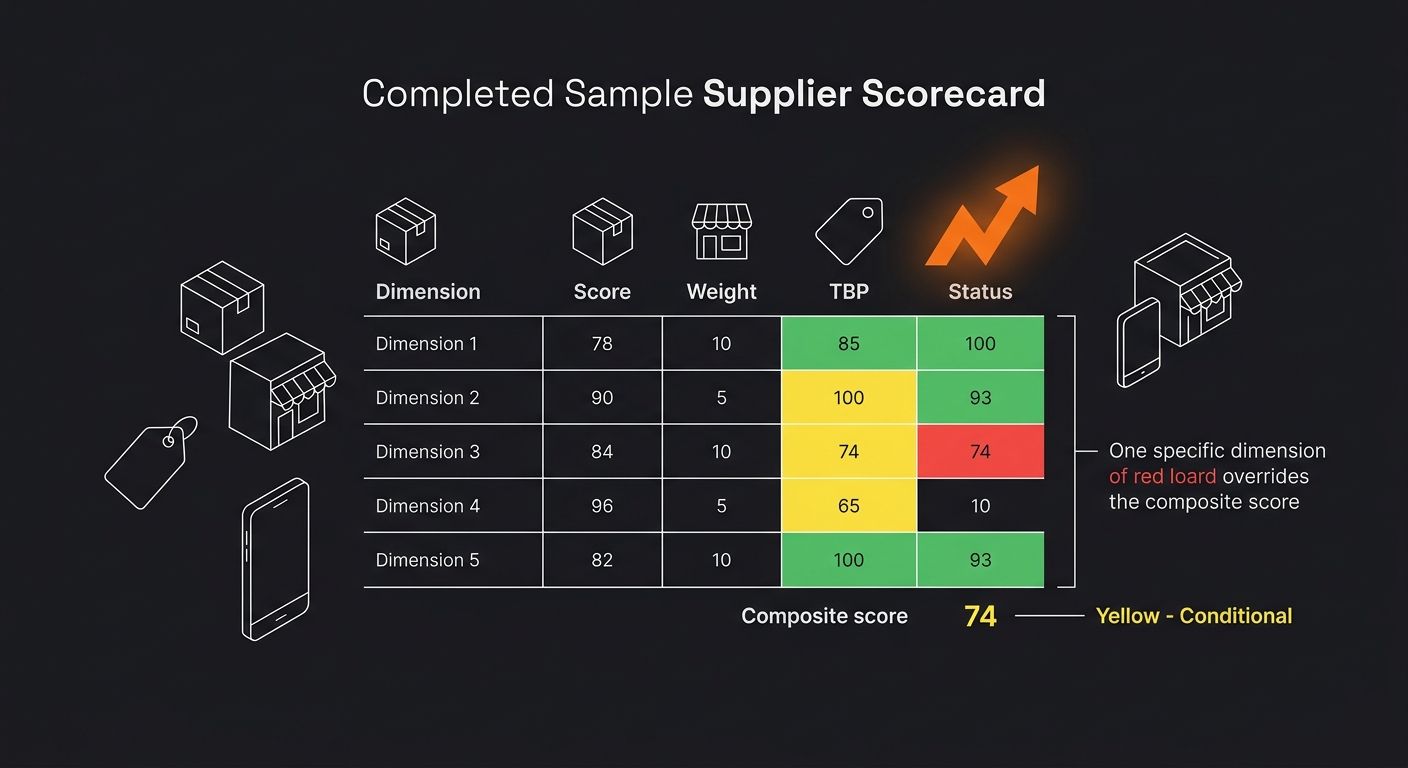
The weighted composite score determines your go/no-go decision. A supplier scoring 80+ overall with no single dimension below 60 gets green-light status. But here's the critical rule: any single red dimension triggers a hold, regardless of the composite score. This prevents a supplier with excellent pricing and documentation from skating past a 75% on-time delivery rate because the other numbers inflate the average.
Lead Time Benchmarking Against Real Numbers
Lead time benchmarking is where most dropshipping supplier vetting falls apart, because operators rely on supplier promises instead of measured reality. Your supplier says "3-5 day processing." Your actual measured processing time across 15 test orders averages 7.2 days. That gap is where chargebacks, bad reviews, and customer service costs live.
For dropshipping specifically, benchmark three separate intervals:
Processing time (order placed to order shipped, supplier's warehouse)
Transit time (shipped to delivered, carrier dependent)
Total lead time (order placed to customer doorstep)
If your total lead time exceeds 14 days for US delivery or 21 days for EU delivery, you're operating outside the window where most customers will wait without filing a dispute. With freight rates climbing due to AI chip demand absorbing air cargo capacity, transit times are getting worse. That makes processing time, the only variable your supplier controls, even more critical to measure and score.
Red Flags That Override Any Score
Some supplier behaviors should trigger automatic disqualification regardless of composite score. QCADVISOR's documentation of 28 supplier visit red flags includes problems most dropshippers never think to check: lack of working backup systems, untested data-restoration procedures, and employees unfamiliar with emergency roles. You're unlikely to visit a factory in person, but the principle translates to remote vetting.
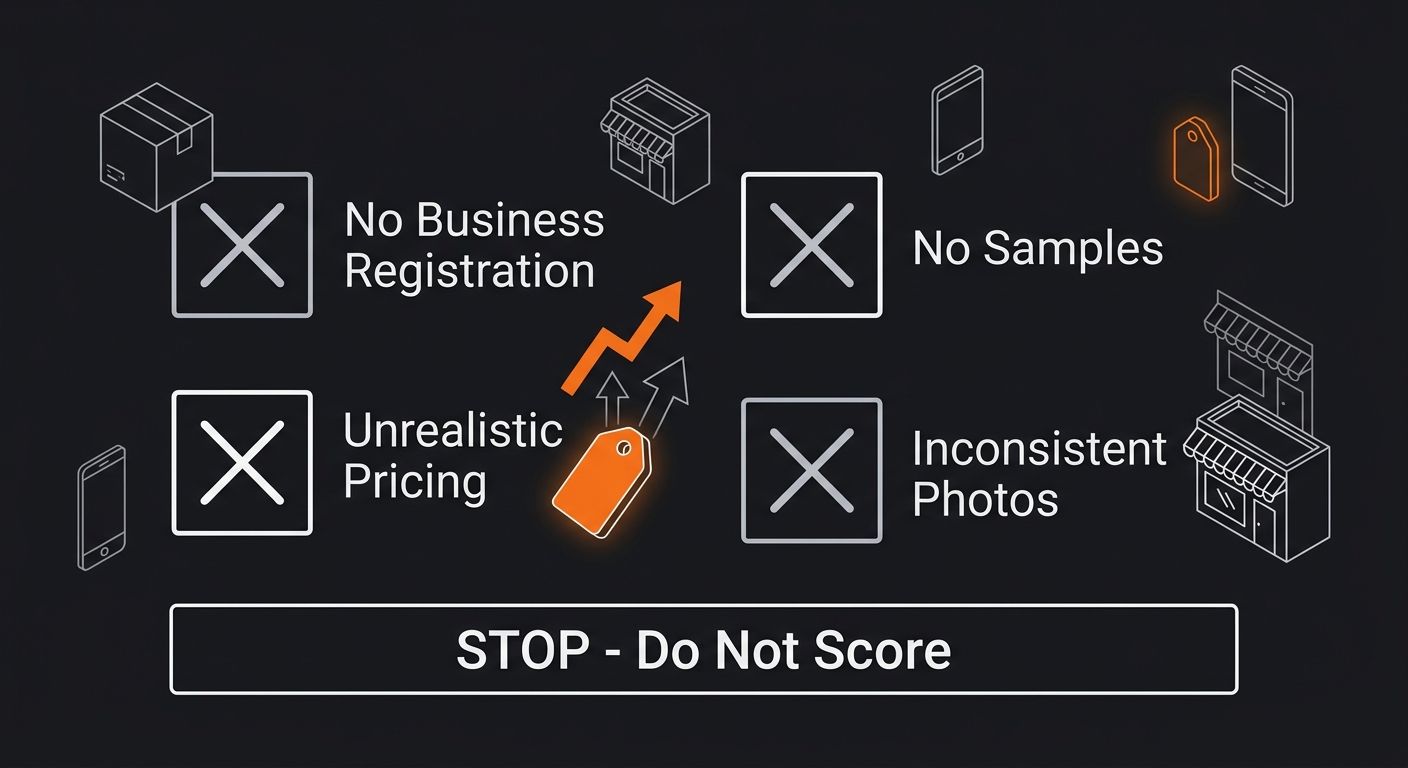
Automatic disqualifiers for any dropshipping supplier quality scorecard:
No verifiable business registration. If the supplier can't prove they're a registered legal entity, walk away. Inventory Source's compliance checklist makes legal entity verification the foundation of supplier evaluation for high-compliance ecommerce categories.
Unrealistically low pricing. A unit cost 40%+ below comparable suppliers signals quality corners being cut, counterfeit goods, or bait-and-switch pricing.
Refusal to send product samples. A supplier confident in their product will let you order 5 units at retail price. Refusal tells you something.
Inconsistent product photos. If the supplier uses different photos across platforms, or their photos don't match the samples you receive, the catalog itself is unreliable.
These disqualifiers function as binary gates. A supplier hits any one, and they don't proceed to scoring. Stores that skip this step often learn the cost through margin destruction; we've explored how review aggregators mislead operators about supplier reliability.
Running the Audit on Suppliers You Already Use
If you're already selling and haven't built a scorecard yet, start by pulling data you already have. Your Shopify or platform analytics contain order-level timestamps that let you calculate real processing and delivery times. Your customer service inbox contains the complaints that reveal your actual defect rate. Your supplier chat history shows real communication response times.
Score your current suppliers retroactively using the matrix above. Most operators who do this for the first time discover that at least one of their "reliable" suppliers scores below 60 in a dimension they never thought to measure, usually communication or documentation. The domestic supplier advantage becomes much clearer once you see overseas suppliers' actual scores next to US-based alternatives on the same weighted scale.
Run this audit before you hit 100 orders with any new supplier. The cost of discovering a bad supplier at order 200, measured in chargebacks, refunds, negative reviews, and wasted ad spend on customers who'll never return, runs 5-8x the cost of placing 15 test orders and spending two hours filling out a scorecard.
Questions the Numbers Still Can't Answer
The 5D Supplier Score framework is measurable and repeatable. It will catch the majority of supplier quality problems before they compound into margin destruction. But three significant blind spots remain.
First, consistency over time. A supplier who scores 85 on your initial audit can drift to 65 within three months if they take on more volume than their operation can handle. Quarterly re-scoring, even a lightweight version using your last 30 days of order data, is the only way to catch this. Current procurement best practices confirm that teams are moving toward quarterly or biannual scorecard reviews specifically to surface emerging risks before they scale.
Second, sub-supplier risk. Your supplier may outsource components or entire product runs to a manufacturer you've never evaluated. Your scorecard measures the entity you interact with, not the entity that actually makes the product. There's no clean fix at dropshipping scale, but asking your supplier directly whether they manufacture in-house or source from third parties, and documenting the answer, gives you a baseline you can reference if quality shifts.
Third, single-product bias. A supplier who scores well on one SKU may perform poorly on another. If you expand your catalog with an existing supplier based on their scorecard for product A, you still need sample orders and a fresh defect-rate measurement for product B. The scorecard is per-supplier-per-SKU, not a blanket endorsement of everything in their catalog.
These gaps don't invalidate the framework. They define where structured evaluation ends and ongoing operational judgment takes over. The scorecard gives you a defensible starting point; the data you collect after order 100 tells you whether to keep scaling with that supplier or start sourcing a replacement before the problems compound.
365 Dropship Editorial
Editorial team writing about E-commerce, dropshipping, and product discovery — reviews of dropshipping suppliers and platforms, trending niche guides (jewelry, beauty, pets, home, fashion), supplier due diligence, ecom operations, shipping & fulfillment strategy, product research, AOV optimization, and profitable dropshipping case studies.
Related Articles

The Supplier Test Order Audit: Using Real Shipments to Spot Quality Collapse Before It Tanks Your Margins
Industry data from 2025 shows that 72% of businesses experienced at least one major supply chain disruption caused by underperforming suppliers.

The Pre-Launch Supplier Test Order Audit: What to Measure Beyond Shipping Speed
A pre-launch supplier audit should measure defect rates, packaging accuracy, documentation completeness, tracking validity, and invoice consistency alongside delivery time. Amazon enforces Order Defect Rates below 1% and Valid Tracking Rates above 95% Valid Tracking.
The Supplier Audit Trap: Why Automation Tools Hide Quality Red Flags Until Your First 100 Orders
DSers, Spocket, and Zendrop all surface supplier scores built from the same thin data: listing age, order volume, and aggregate star ratings.
Explore more topics