Profit Margin Calculator Guide
Multiplying your product cost by 1.30 does not give you a 30% profit margin. It gives you a 23% margin, and that seven-point gap is where thousands of ecommerce operators silently lose money every month.

Profit Margin Calculator Guide: How to Price Products Without Bleeding Money
Multiplying your product cost by 1.30 does not give you a 30% profit margin. It gives you a 23% margin, and that seven-point gap is where thousands of ecommerce operators silently lose money every month. A profit margin calculator corrects this by dividing profit by revenue (not by cost), showing you the actual percentage of each sale you keep.
Margin vs. Markup: The Calculation That Costs You Thousands
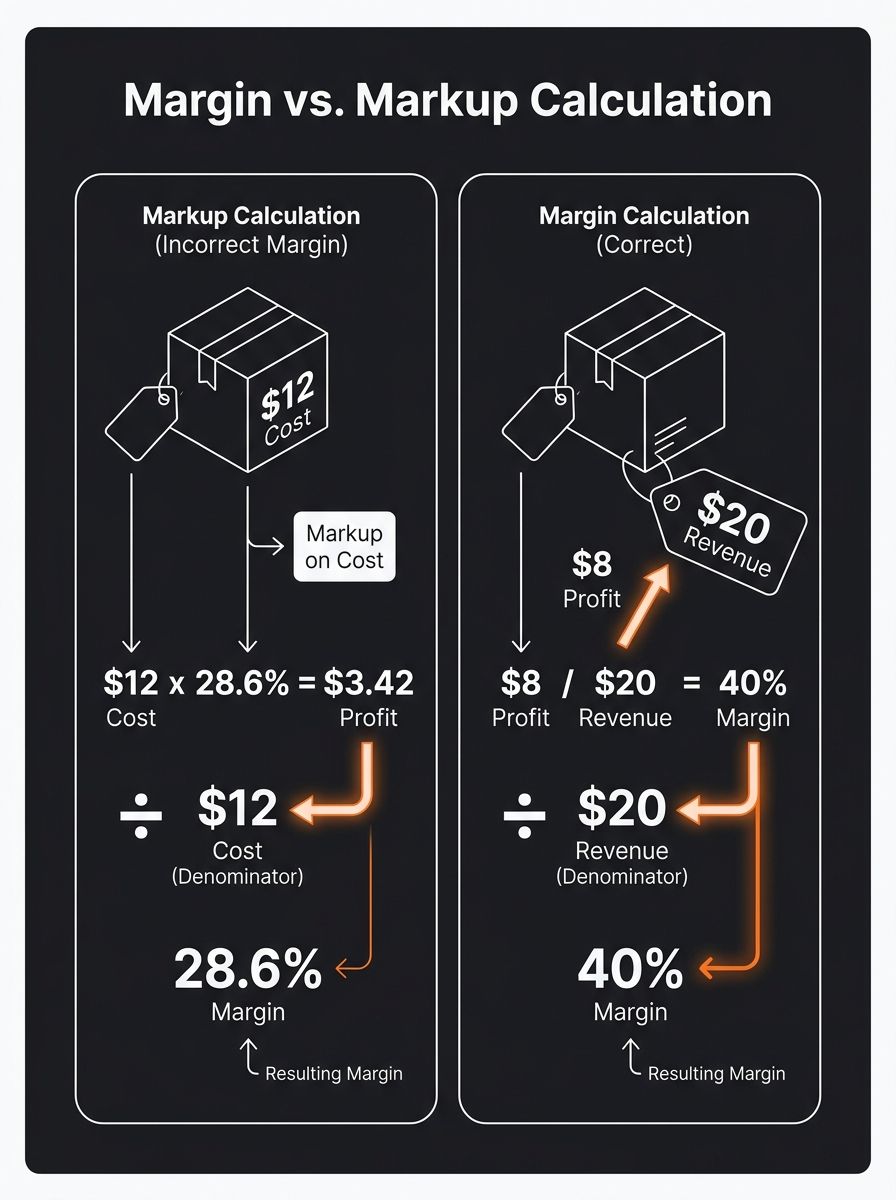
The confusion between margin and markup is responsible for more mispriced products than any other single error in ecommerce. Margin is calculated as a percentage of your selling price. Markup is calculated as a percentage of your cost. They use different denominators, and that difference changes your pricing math dramatically.
Here's a concrete example. You source a product for $12 and want a 40% profit margin. If you mistakenly apply a 40% markup, you'd price at $16.80 ($12 × 1.40). Your actual profit is $4.80, and your actual margin is $4.80 / $16.80 = 28.6%. You're twelve full percentage points below your target.
The correct calculation for a 40% margin: divide cost by (1 - 0.40), so $12 / 0.60 = $20.00. Your profit is $8.00, and your margin is $8.00 / $20.00 = 40%. That's a $3.20-per-unit difference on the same product, from the same supplier, with the same ad spend.
As Xero's margin guide states, there are three profit margin formulas: gross, operating, and net, and each divides a profit figure by revenue and multiplies by 100. The denominator is always revenue.
The Three Formulas You Actually Need
Why do three different margin calculations exist? Because each one captures a different layer of your business costs, and understanding where money disappears between gross and net is the difference between scaling and stalling.
Gross Profit Margin = (Revenue - COGS) / Revenue × 100
This is the number most operators fixate on. It measures what's left after subtracting the direct cost of the product. For a dropshipping store, COGS includes your supplier price, inbound shipping, and any per-unit fees your aggregator charges. If you're unclear on how aggregator platforms layer fees between factory price and your landed cost, your gross margin number is already wrong.
Operating Profit Margin = (Revenue - COGS - Operating Expenses) / Revenue × 100
This is where Shopify subscriptions, app fees, payment processing charges (typically 2.9% + $0.30 per transaction on Shopify Payments), ad spend, and labor costs get subtracted. Operators who carry too many apps on their Shopify store often watch a healthy 45% gross margin shrink to a 12% operating margin without understanding why.
Net Profit Margin = Net Income / Revenue × 100
The final number after taxes, interest, and every other expense. According to Investopedia's margin formula guide, businesses that regularly review and discontinue underperforming products can improve their net profit margin, assuming revenue is maintained or improves. This is the number that determines whether your business can actually pay you.
Margin Type | Formula | What It Captures | Healthy Benchmark (Dropshipping) | Common Mistake |
|---|---|---|---|---|
Gross | (Revenue - COGS) / Revenue × 100 | Product cost only | 30–50% | Ignoring supplier fees |
Operating | (Revenue - COGS - OpEx) / Revenue × 100 | Product cost + overhead | 15–25% | Forgetting app and ad costs |
Net | Net Income / Revenue × 100 | Everything including taxes | 10–20% | Treating gross as net |
Running the Numbers on a Real Product
The formulas above stay abstract until you apply them to an actual SKU. So here's a scenario pulled from a home goods dropshipping store.
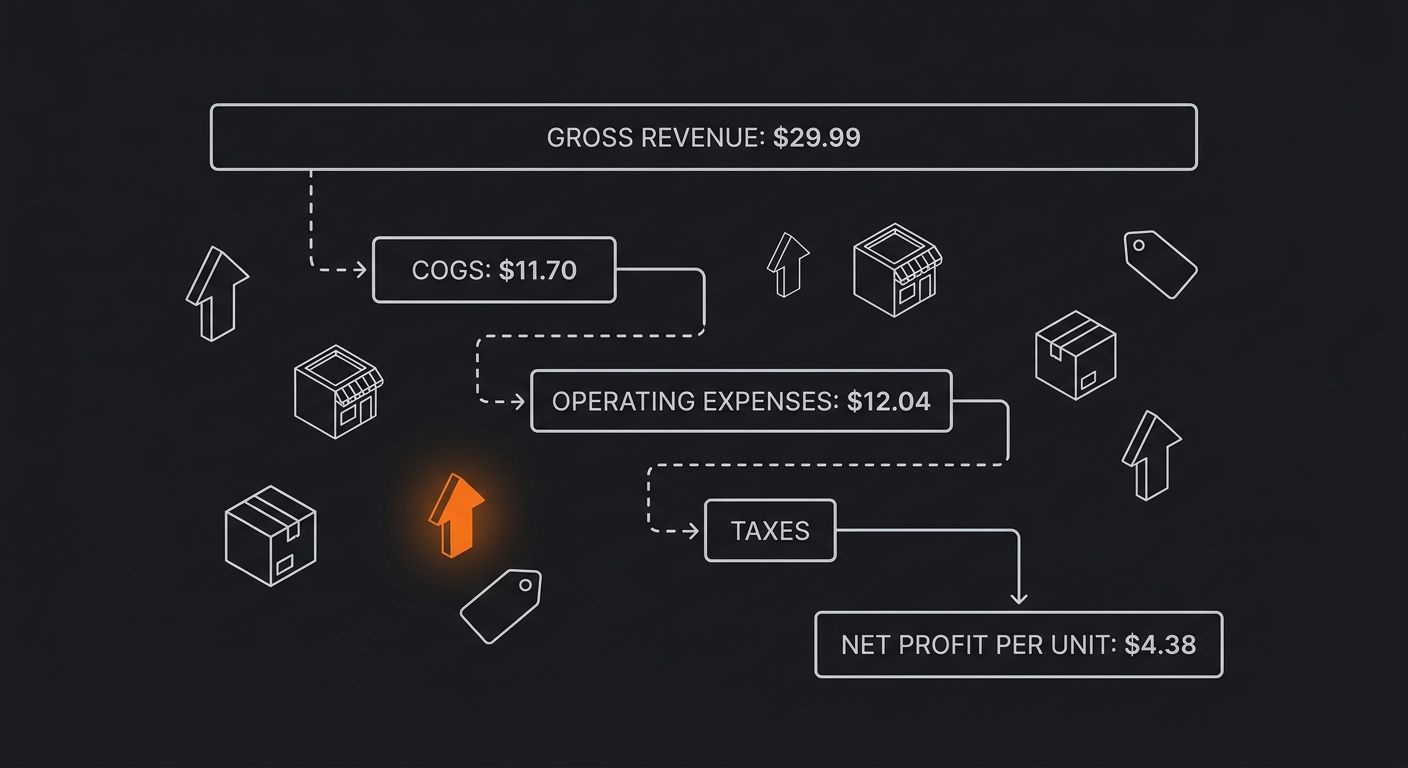
You source a bamboo desk organizer from a Spocket supplier for $8.50. Shipping to the customer costs $3.20 (US-based fulfillment). Your total COGS is $11.70. You price the product at $29.99.
Gross profit: $29.99 - $11.70 = $18.29. Gross margin: $18.29 / $29.99 × 100 = 61%. Looks great on a dashboard screenshot.
But your operating costs per order include: Shopify plan allocation ($0.85/order based on $39/month and roughly 46 orders/month), payment processing ($1.17 at 2.9% + $0.30), Facebook ad cost to acquire ($9.40 at a $28 CPA with 3:1 return on ad spend), and app subscriptions allocated per order ($0.62).
Total operating cost per order: $12.04. Operating profit: $18.29 - $12.04 = $6.25. Operating margin: $6.25 / $29.99 × 100 = 20.8%.
After estimated self-employment tax and income tax on that profit (roughly 30% combined for a sole proprietor in the US), your net take-home per unit drops to about $4.38, putting net margin at 14.6%.
That 61% gross margin became 14.6% net. This is why a profit margin calculator that accounts for all three layers is essential, and why operators who only track gross margin get blindsided when revenue climbs but their bank account stays flat.
Where Dropshipping Operators Leak the Most Margin
The math above assumed stable, predictable costs. Real operations rarely work that way. Three specific areas cause the worst margin erosion for stores doing $5K–$50K/month in revenue.
Returns and refunds eat directly into your gross margin without reducing your ad spend. A 10% return rate on the bamboo organizer example above doesn't cost you 10% of revenue. It costs you 10% of revenue plus the original ad acquisition cost for those returned orders, plus any return shipping you absorb. On a $29.99 product with a $9.40 CAC, each return costs you $21.10 in total wasted spend.
Currency fluctuation on international suppliers can shift your COGS by 3–8% quarter over quarter. If you're sourcing from a Chinese supplier and the yuan strengthens against the dollar, your $8.50 product cost might creep to $9.10 without any change in the supplier's pricing structure. Operators who rebuilt their supplier stack after tariff shocks learned this lesson in a painful and expensive way.
Ad platform cost inflation is the quietest margin killer. Facebook and Instagram CPMs have risen steadily, and a $28 CPA in Q1 can easily become $36 in Q4 during holiday competition. That alone drops your operating margin from 20.8% to 14.1% on the same product at the same price. According to BigTime's profitability analysis, even small pricing adjustments can significantly increase margins without raising costs, which is why repricing during high-CPM seasons matters more than most operators realize.
The Three-Layer Margin Audit
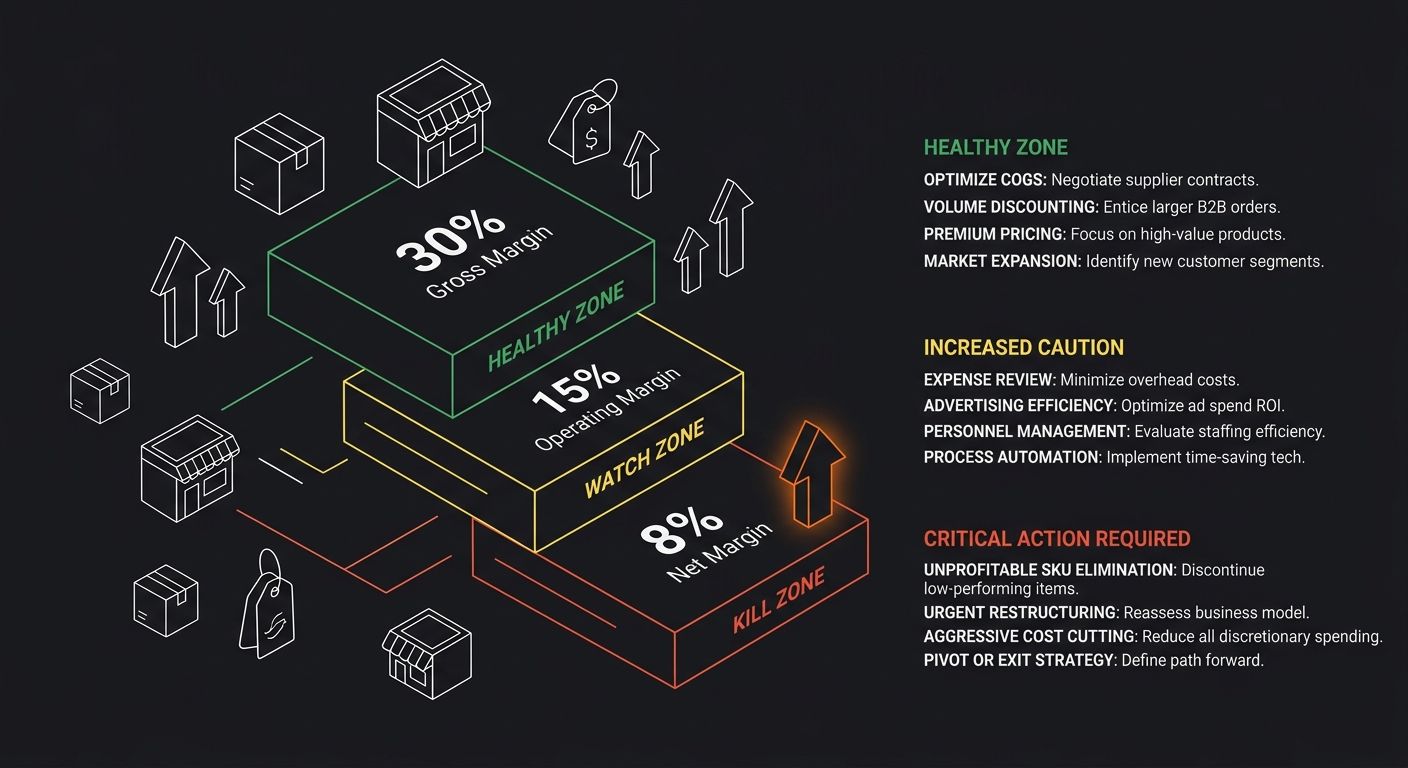
I've used a framework across 14 product launches that catches margin decay before it kills a product line. The structure is straightforward: evaluate every SKU monthly across gross, operating, and net margin, and set kill-switch thresholds for each layer.
Set your gross margin floor at 30%. If a SKU's gross margin drops below 30%, you have a supplier cost problem or a pricing problem, and the fix is renegotiation or repricing. I've written before about why a disciplined 30% gross margin business outperforms most supposedly high-margin stores, and the reasoning starts with this threshold.
Set your operating margin floor at 15%. Below this, your overhead or ad costs are consuming too much of the unit economics. The fix is cutting app bloat, improving ad creative to lower CPA, or finding operational efficiencies in fulfillment.
Set your net margin floor at 8%. Below 8% net, you're working for free after taxes and unexpected costs. The fix is usually a combination of the above, or discontinuing the product entirely.
Any SKU that falls below all three thresholds in the same month should be paused immediately. Any SKU that falls below two of three for two consecutive months gets reviewed for discontinuation. This audit takes 20 minutes per SKU per month if you keep a spreadsheet with your current supplier costs, platform fees, and ad CPAs. The operators I've consulted for who skip this step are always the ones surprised by a negative-margin month.
What Still Gets Miscalculated
Even operators who understand the margin formula and run the numbers regularly miss two things consistently.
The first is blended margin across SKUs. If you sell five products with margins ranging from 12% to 45%, your blended margin depends on revenue weighting, not a simple average. A SKU with 12% margin that accounts for 60% of your revenue drags your overall margin down far more than a 45% margin product selling three units a week lifts it up. Weight by revenue dollars, not by SKU count.
The second is the contribution of free traffic to margin. Operators who acquire 40% of their orders through organic search or email have fundamentally different operating margins than those running 100% paid acquisition. Your profit margin calculator inputs need to reflect your actual channel mix, because two stores selling the same product from the same supplier at the same price can have operating margins 15 percentage points apart based purely on their traffic source ratio. If you're building organic acquisition from the ground up, the beginner's guide to dropshipping covers foundational decisions that shape your margin profile for years to come.
The profit margin calculator is one of the simplest tools in ecommerce, and the formulas behind it haven't changed. What changes is whether you feed it honest numbers or comfortable ones, and whether you track all three layers or let a flattering gross margin convince you the business is healthier than it is.

Ryan Torres
Ryan Torres is a former Amazon FBA seller turned dropshipping consultant who has generated over $2.8M in ecommerce revenue across 14 product launches. He specializes in supplier vetting, margin optimization, and scaling DTC operations for sub-$1M brands. Ryan focuses on actionable frameworks that drive measurable results for independent operators.
Related Articles
Stop Chasing 60% Margins: Why a Disciplined 30% Gross Margin Business Outperforms Most 'High-Margin' Dropshipping Stores
A 60% gross margin on a $50 dropshipped product leaves $30 before costs. After $12 in ad spend, $2 in payment processing, $1 in platform fees, and $3 in return-related losses, that $30 becomes $12 — a 24% net margin.

The Post-Sale Audit Framework: How to Diagnose Which Dropshipping Mistakes Are Actually Costing You Margin
Theoretical margin on a $34.99 pet grooming kit sold through Shopify: 42%. Actual margin after pulling the last 100 fulfilled orders, tallying refund shipping labels, Facebook ad spend allocated per unit, and three chargebacks at $22 each: 19%.

Inside the Supplier Markup Stack: How Aggregator Platforms Layer Fees Between Factory Price and Your Cost of Goods
Three to seven distinct fee layers sit between a product's factory price and the number aggregator platforms display as your "supplier cost." Fulfillment surcharges, payment processing cuts, per-order fees, and shipping markups each compound silently.
Explore more topics