
Margin Formula Excel
Excel's core margin formula is =(Revenue-Cost)/Revenue, applied to each SKU row and formatted as a percentage.
Tag
8 articles
Excel's core margin formula is =(Revenue-Cost)/Revenue, applied to each SKU row and formatted as a percentage.

Markup and margin produce different percentages from the same dollar amounts: a $15 cost and $20 sale price gives you 33% markup but 25% profit margin. This tutorial shows you how to calculate profit percentage at both the gross and net level, then verify your math with four free online calculators.

The profit margin formula divides profit by revenue and multiplies by 100. Gross margin uses (Revenue − COGS) / Revenue. Net margin uses Net Income / Revenue. This guide walks you through calculating both in under 15 minutes using free online calculators and a basic spreadsheet.

Profit margin measures how many cents of every revenue dollar you actually keep after costs. This guide walks you through calculating gross, operating, and net margin in under 15 minutes using real product numbers and formulas you can drop straight into a spreadsheet.

Multiplying your product cost by 1.30 does not give you a 30% profit margin. It gives you a 23% margin, and that seven-point gap is where thousands of ecommerce operators silently lose money every month.

A 60% gross margin on a $50 dropshipped product leaves $30 before costs. After $12 in ad spend, $2 in payment processing, $1 in platform fees, and $3 in return-related losses, that $30 becomes $12 — a 24% net margin.

Your Meta Ads dashboard and Shopify analytics both report customer acquisition cost using a flawed denominator: total customers, including repeat buyers.
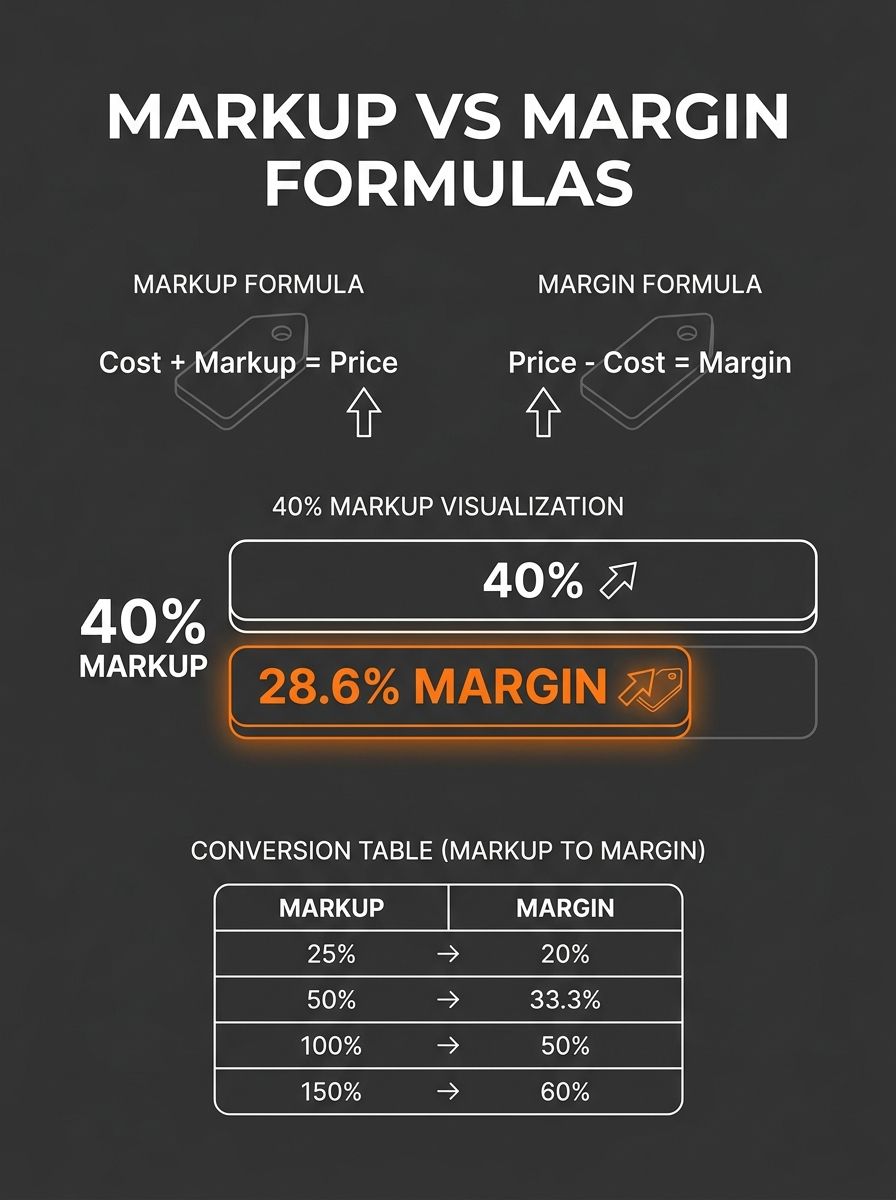
A 40% markup on a $15 product gives you a $21 selling price and $6 in gross profit. Divide that $6 by the $21 sale price and you get 28.6%, which is your actual gross margin. The 11.