The Shopify App Store Is a Margin Tax: Why Most Operators Install 3x More Tools Than They Need
Eight JavaScript-heavy Shopify apps add 1-2 full seconds of page load time and produce a 7-14% conversion rate drop, according to App Store Research performance benchmarks.

The Shopify App Store Is a Margin Tax: Why Most Operators Install 3x More Tools Than They Need
Eight JavaScript-heavy Shopify apps add 1-2 full seconds of page load time and produce a 7-14% conversion rate drop, according to App Store Research performance benchmarks. Every installed app carries two costs: the subscription fee on the monthly invoice and the invisible speed tax applied to every single page view.
The $250K Growth Stage and Its 22-App Inheritance
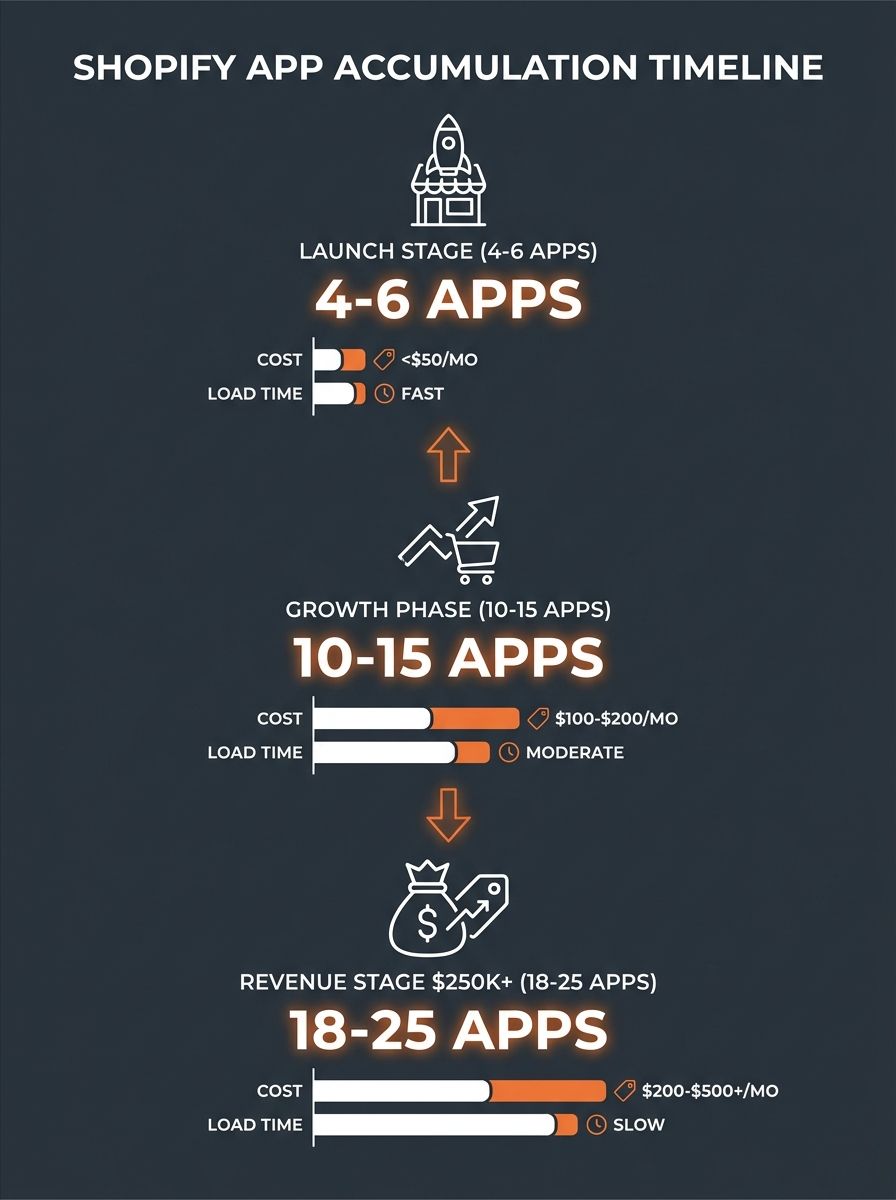
Ecommerce Fastlane's tech stack audit documentation describes a repeating pattern so predictable it reads like a script. A Shopify store launches with 4-6 apps. By the time it crosses $250K in annual revenue, it's running somewhere between 18 and 25 installed apps, most added in a hurry during a product launch, a holiday campaign, or a panic about abandoned carts. As the audit data shows, the accumulation from years one and two starts bleeding into unit economics through rising operational costs, degraded site performance, and a team stretched thin managing integrations rather than executing strategy.
The typical trajectory looks like this. Month one: Shopify plan ($39/month on Basic), a sourcing app (DSers, Spocket, or CJDropshipping at $0-$30/month), maybe a free reviews app, a free shipping bar. Total Shopify app costs: under $50/month. Perfectly reasonable. By month fourteen, that same store has stacked on a paid reviews app upgrade ($15-$25/month), an email marketing platform ($20-$60/month), an upsell app ($15-$30/month), a loyalty program ($20-$50/month), an SMS tool ($25-$100/month), an analytics dashboard ($30-$80/month), a page builder ($15-$40/month), a currency converter ($10/month), an SEO plugin ($20/month), a countdown timer ($5-$10/month), and three or four more micro-tools for things like social proof popups, trust badges, and back-in-stock notifications. The subscription line items alone now sit between $200 and $500/month before you've paid a dollar in ad spend or fulfilled a single order.
And that monthly subscription number is the easy part of the math. The harder part lives in load time.
50-200 Milliseconds Per App, Compounded Eight Times
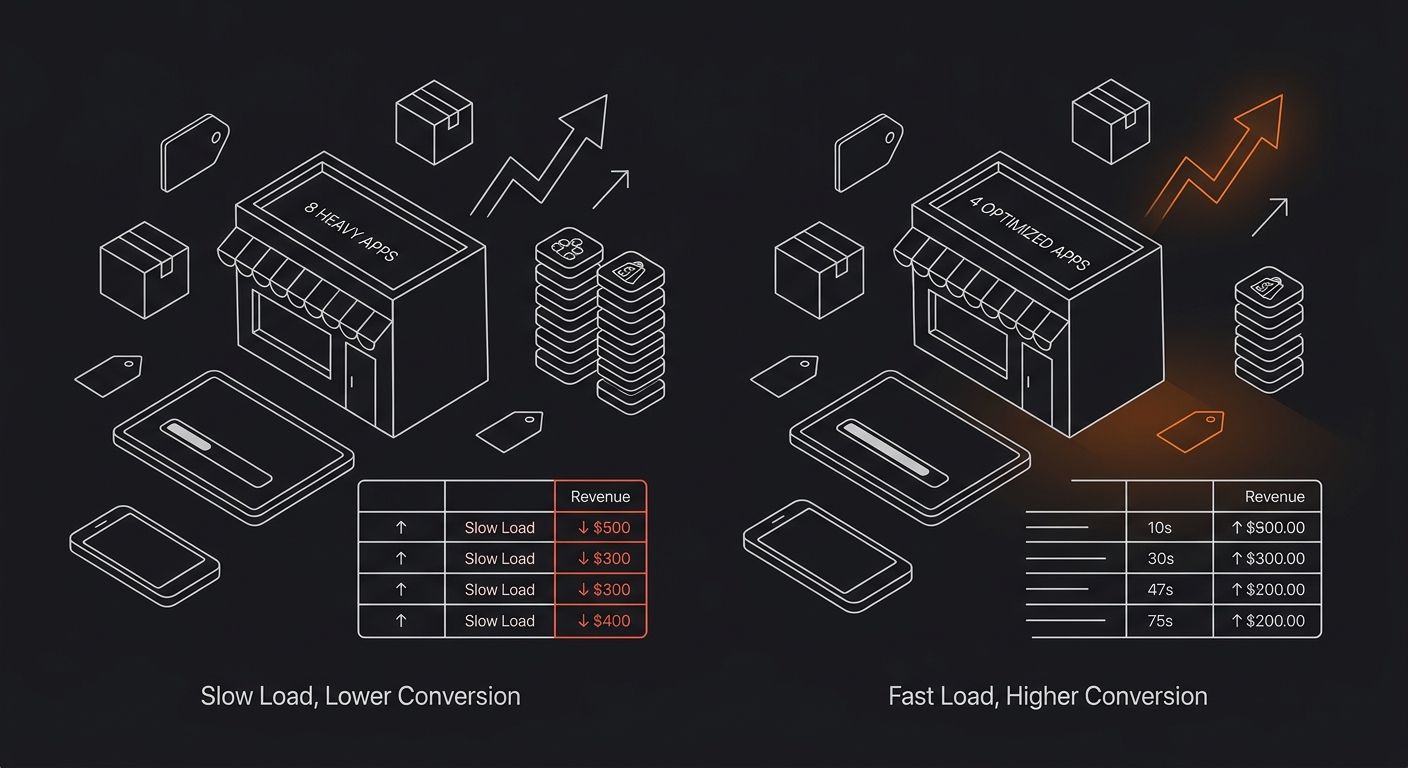
App Store Research's performance guidance puts the damage in specific terms: each storefront app adding JavaScript increases load time by 50-200 milliseconds. That range matters because it compounds. Eight heavy apps don't add 400ms at the low end and 1,600ms at the high end in theory. They add 1-2 full seconds in practice, because apps load sequentially, compete for browser resources, and sometimes fire conflicting scripts that create render-blocking chains.
A 1-second load time increase maps to roughly a 7% conversion rate drop. A 2-second increase pushes that to 14%. For a store doing $30K/month in revenue at a 2.5% conversion rate, a 14% relative conversion drop means the store is losing approximately $4,200/month in revenue it would otherwise capture. That's $50,400/year of lost top-line from apps that were installed to increase revenue.
The irony is structural. You installed the upsell app to lift AOV by $8-$12. But the upsell app and all its neighbors on the app stack margin slowed your store enough to lose 14% of the people who would have completed checkout. If you're running tight dropshipping margins already, and a healthy Shopify store targets 50-70% gross and 10-20% net, even a few percentage points of conversion rate loss wipes out the margin improvement the app was supposed to deliver.
When we covered the true cost comparison between Shopify and WooCommerce, platform fees were the obvious comparison point. But Shopify app costs are the variable that operators consistently undercount because each individual app subscription looks cheap. The damage is cumulative.
Red Technology's analysis of app overload in ecommerce makes the mechanism explicit: apps sit outside the platform's core code, layered on top of each other, and each one adds complexity that degrades performance. They aren't optimized to work together. They're optimized to work alone, on a store that has nothing else installed. The moment you stack five, eight, twelve of them, the performance assumptions each developer made during QA are invalid.
Speed Boostr's Four-Bucket Sort
Speed Boostr's Shopify audit framework offers the clearest method for deciding which apps stay and which ones go. The process categorizes every installed app into one of four quadrants based on two axes: business impact (does this app directly generate revenue or serve a critical operational function?) and performance cost (how much does this app slow down the storefront?).
The four categories shake out like this:
Bucket | Business Impact | Performance Cost | Action |
|---|---|---|---|
Essential + Low Impact | High (revenue-generating or operationally critical) | Low (minimal JavaScript, no render blocking) | Keep. These are your foundation. |
Essential + High Impact | High (necessary for fulfillment, sourcing, or email) | High (heavy scripts, external API calls on every page load) | Keep but optimize. Move scripts to load after page render. Replace with lighter alternatives if possible. |
Non-Essential + Low Impact | Low (nice-to-have, rarely used features) | Low (small footprint) | Evaluate quarterly. These don't hurt much individually but contribute to total Shopify overhead in aggregate. |
Non-Essential + High Impact | Low (cosmetic, redundant, or unused) | High (significant JavaScript, render blocking) | Remove immediately. These are pure margin destruction. |
The consistent finding across Speed Boostr's audits is that stores classify fewer than 40% of their installed apps as genuinely essential. The rest fall into the bottom two quadrants. And the bottom-right quadrant, the "Non-Essential + High Impact" group, typically holds 3-5 apps that the store owner forgot they installed, or installed for a single campaign six months ago and never removed.
This maps directly to the pattern we explored in our piece on the automation tool selection trap: feature parity between competing apps doesn't translate to profit growth. Operators install three email tools because each one has a feature the others lack, when the answer is one email tool configured properly.
The four-bucket sort also exposes a pattern in how ecom operating expenses creep upward without any single decision feeling expensive. A $15/month app looks like nothing. Twenty of them at an average of $18/month is $360/month, or $4,320/year. For a store with $300K in annual revenue running a 15% net margin ($45K net profit), that $4,320 in app subscriptions represents 9.6% of total net profit going to tools, before you account for the conversion rate penalty those tools create.
The Cost Sheet After the Purge
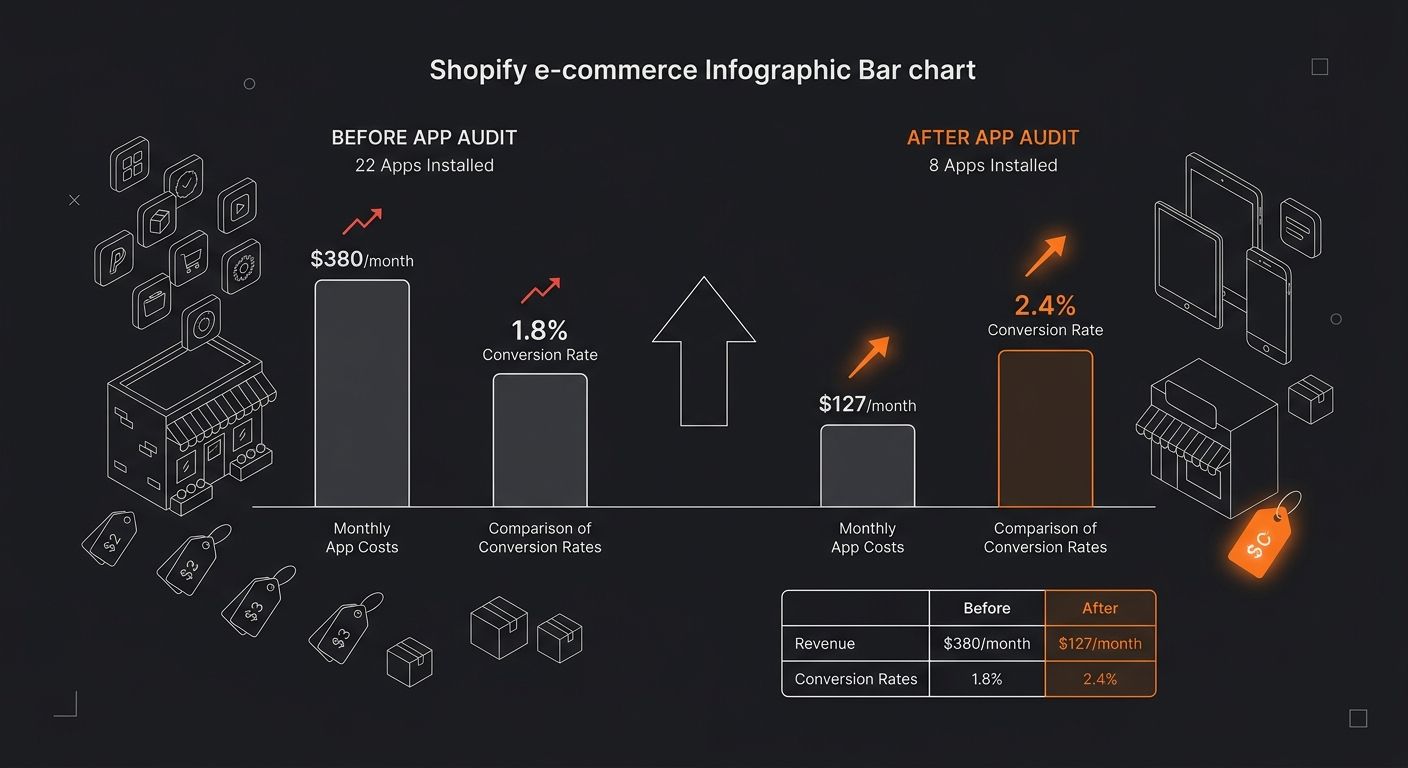
Running the numbers on a typical audit produces results that are embarrassing in hindsight but instructive going forward. Take the documented $250K-to-$1M growth-stage store profiled in Ecommerce Fastlane's audit data. Before the audit: 22 apps installed, roughly $380/month in total app subscriptions, 4.2-second average page load time, 1.8% conversion rate. After the audit: 8 apps retained, $127/month in subscriptions, 2.1-second page load, conversion rate recovery to 2.4%.
The monthly savings on subscriptions alone: $253. But that's the small number. The conversion rate recovery from 1.8% to 2.4% on the same traffic volume represents a 33% lift in orders. On a $30K/month revenue base, that's roughly $10,000/month in recovered revenue.
This is where the "margin tax" framing becomes concrete. The dropshipping tool costs that were supposed to optimize the business were actually the largest single drag on its conversion rate, bigger than ad creative quality, bigger than product page copy, bigger than pricing strategy. The checkout flow audit process catches some of this, but the app stack problem sits upstream of checkout. Visitors never reach checkout because the page took 4.2 seconds to load and they bounced.
The eight apps that survived the cut in a typical lean dropshipping stack break down into predictable categories: one sourcing/fulfillment tool (DSers, Spocket, or CJDropshipping), one email marketing platform (Klaviyo or a lighter alternative), one reviews app (Judge.me's free tier handles most use cases), one analytics tool (often replaced by native Shopify analytics plus Google Analytics 4, meaning zero app cost), and 2-3 operational tools specific to the store's fulfillment complexity. If you're running multi-supplier order routing, that routing logic counts as essential. If you're running a single supplier, it doesn't.
Swell's app fatigue research adds behavioral data to the financial case: ecommerce retention rates sit at 4.2%, and the constant juggling of third-party plugins and fragmented tools creates operational overhead that directly hits conversion rates and customer experience. Fragmentation shows up in inconsistent UI elements, conflicting pop-ups firing simultaneously, and loyalty widgets that load three seconds after the customer has already scrolled past them.
The Eight-App Ceiling and When to Break It
The documented pattern across multiple audit sources points to a practical ceiling: eight apps handles nearly every function a sub-$1M dropshipping store requires. Going above eight demands a specific justification for each additional install, measured against the 50-200ms load time penalty it carries.
There are legitimate reasons to exceed eight. Stores operating in regulated product categories may need compliance tools. Stores running heavy post-purchase email sequences for repeat revenue recovery may need both an email platform and a separate SMS tool if their primary platform doesn't handle both channels natively. Stores selling across multiple channels may need channel-specific sync tools.
But those are exceptions with clear revenue justifications, where the app stack margin impact has been calculated against the revenue the app generates. The default position for any operator reviewing their dropshipping tool costs should be: if this app can't demonstrate a measurable contribution to revenue or a reduction in fulfillment errors, it's a candidate for removal.
Every dollar you save on app subscriptions drops directly to net margin. Every 200ms of load time you recover converts a fraction of the visitors who were bouncing. The stores that treat their app stack as inventory to be managed, counted, and culled perform measurably better than stores that treat the Shopify App Store as a buffet. The math is specific enough to verify on your own store, with your own traffic numbers, within a single afternoon.
365 Dropship Editorial
Editorial team writing about E-commerce, dropshipping, and product discovery — reviews of dropshipping suppliers and platforms, trending niche guides (jewelry, beauty, pets, home, fashion), supplier due diligence, ecom operations, shipping & fulfillment strategy, product research, AOV optimization, and profitable dropshipping case studies.
Related Articles

How to Start Dropshipping: A Beginner's Guide
Starting a dropshipping store requires three connected layers: a storefront platform (Shopify leads), a supplier automation app (DSers, Spocket, or Zendrop), and a payment-plus-shipping configuration.

How to Audit Your Shopify Store's Checkout Flow for Margin Leaks in Under 2 Hours
Forty-eight percent of Shopify cart abandonment traces to a single trigger: extra costs (shipping, taxes, handling fees) appearing for the first time on the payment screen, according to Baymard Institute research aggregated across dozens of ecommerce usability studies.
Shopify vs. WooCommerce for Dropshipping in 2026: Total Cost of Ownership When Margins Are Already Thin
Shopify holds 27% of the ecommerce platform market while WooCommerce powers 36–38% of online stores, yet those market-share numbers reveal nothing about which platform actually costs less to operate a dropshipping business on.
Explore more topics