Profit Margin Formula: Calculate & Improve
The profit margin formula divides profit by revenue and multiplies by 100. Gross margin uses (Revenue − COGS) / Revenue. Net margin uses Net Income / Revenue. This guide walks you through calculating both in under 15 minutes using free online calculators and a basic spreadsheet.

Profit Margin Formula: How to Calculate and Improve Ecommerce Margins Using Free Tools
The profit margin formula divides profit by revenue and multiplies by 100. Gross margin uses (Revenue − COGS) / Revenue. Net margin uses Net Income / Revenue. This guide walks you through calculating both in under 15 minutes using free online calculators and a basic spreadsheet.
Before You Start
You need three things before running these calculations: your total revenue for a defined period (monthly works best for ecommerce), your cost of goods sold for that same period, and a full list of operating expenses including app subscriptions, ad spend, shipping costs, and transaction fees.
If you're on Shopify, pull revenue from Analytics > Reports > Sales over time. COGS comes from your supplier invoices or, if you use an inventory app, from its cost-per-unit tracking. Operating expenses live across your payment processor statements, ad platform dashboards, and Shopify billing page.
Time required: 10–15 minutes for the first calculation, 5 minutes each month after you've built the spreadsheet.
Tools you'll use:
Sage's free margin calculator for quick one-off checks
Omnicalculator's margin tool for comparing margin vs. markup side by side
Google Sheets or Excel for ongoing tracking
Step 1: Calculate Your Gross Profit Margin
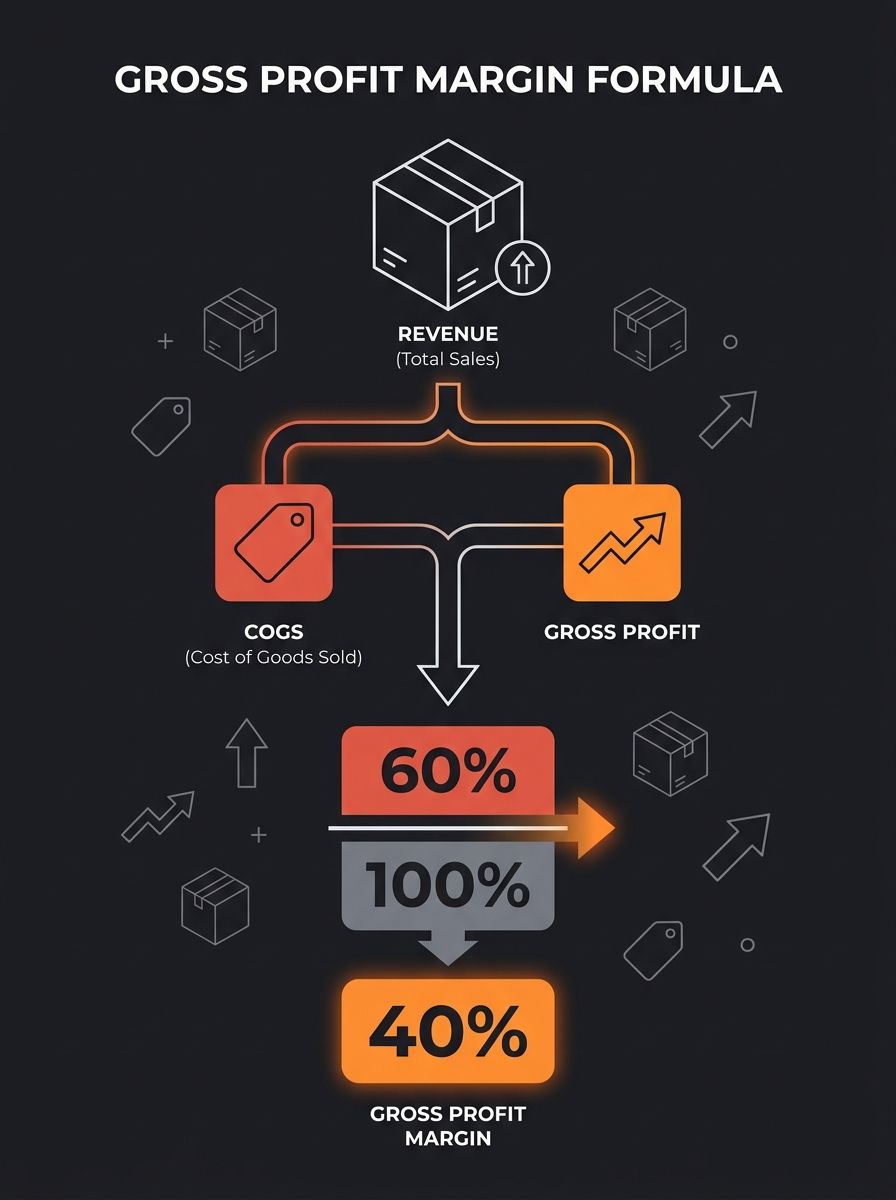
Gross profit margin tells you what percentage of each dollar survives after paying your supplier. The formula is (Revenue − COGS) / Revenue × 100. According to Investopedia's profit margin breakdown, you can set this up in any spreadsheet with (C2/A2) × 100 where C2 holds gross profit and A2 holds revenue.
Here's a real example using typical dropshipping numbers:
Line Item | Amount |
|---|---|
Revenue (100 units × $39.99) | $3,999.00 |
COGS (100 units × $14.50 from supplier) | $1,450.00 |
Gross Profit | $2,549.00 |
Gross Profit Margin | 63.7% |
That 63.7% looks healthy. But gross margin hides every expense sitting between you and actual profit. As Citizens Bank's business resource puts it, "Gross profit margin is a percentage measurement that shows the profit on revenue earned," while net profit is "profit remaining after deducting all business expenses from revenue." Two different formulas, two very different stories about your business.
Verification: Your gross margin should fall between 20% and 80% for a typical ecommerce product. If it's above 80%, double-check that you've included all supplier costs (packaging, labeling fees, MOQ surcharges). Below 20% on a dropshipped product means your pricing or supplier costs need immediate attention.
Step 2: Calculate Your Net Profit Margin
Net profit margin reveals what you actually keep after every bill is paid. The formula is (Revenue − All Expenses) / Revenue × 100. Investopedia's guide on gross vs. net margin clarifies that "gross margin measures profit after accounting for production costs, excluding overhead expenses," while "net margin accounts for all expenses."
Using the same 100-unit example, here's what happens when real operating costs enter the picture:
Expense Category | Amount |
|---|---|
Revenue | $3,999.00 |
COGS | $1,450.00 |
Shipping (100 × $6.80) | $680.00 |
Facebook/Meta ads | $720.00 |
Shopify plan + apps | $158.00 |
Transaction fees (2.9% + $0.30) | $145.97 |
Returns (8% rate, 8 units refunded) | $319.92 |
Total Expenses | $3,473.89 |
Net Profit | $525.11 |
Net Profit Margin | 13.1% |
That 63.7% gross margin collapsed to 13.1% net. The gap between those two numbers is where most dropshipping businesses bleed out, and it's the gap you should obsess over.
Verification: For ecommerce and dropshipping, healthy net margins range from 10% to 20%. Below 10% signals a structural cost problem. Above 25%, verify you haven't missed an expense category.
Step 3: Benchmark Against Industry Standards
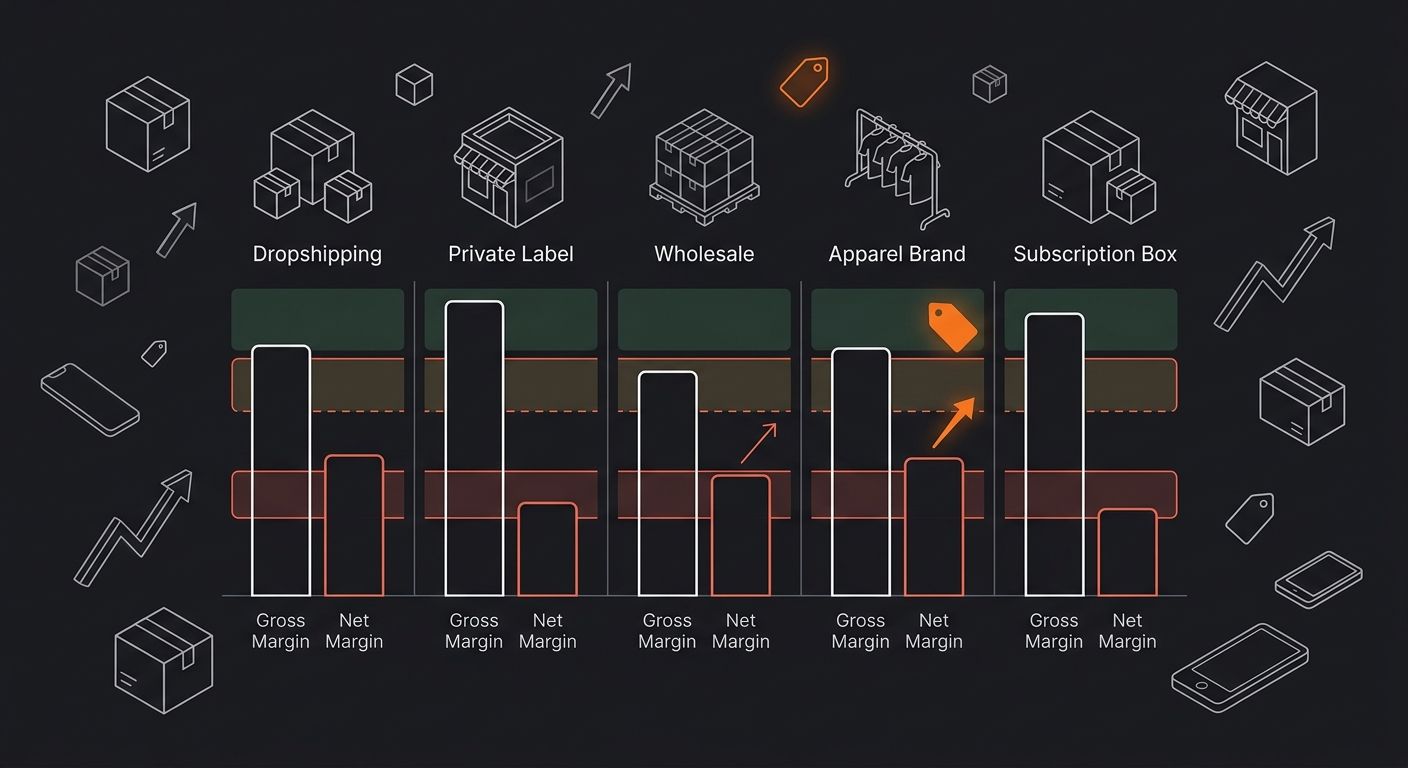
A profit margin formula output is only useful when you know whether your result is competitive. Crestmont Capital's 2026 industry benchmarking guide positions these baselines as "a real-world baseline to measure performance, identify gaps, and make smarter decisions about growth, pricing, and financing."
Here are realistic 2026 benchmarks for common ecommerce categories:
Business Type | Avg Gross Margin | Avg Net Margin |
|---|---|---|
General dropshipping | 15–45% | 10–15% |
Print-on-demand | 25–40% | 8–15% |
Private label DTC | 50–70% | 15–25% |
Beauty/cosmetics dropshipping | 40–65% | 12–20% |
Electronics dropshipping | 8–20% | 3–8% |
If you're running a Shopify store with multiple paid apps, those subscription costs compress net margin by 2–5 percentage points compared to operators who keep their app stack lean. Electronics sellers operate on razor-thin margins and need volume to compensate. Beauty and cosmetics sellers who've vetted Chinese suppliers properly tend to land in the upper range because perceived value supports higher retail pricing.
Verification: Your margins should fall within the ranges above for your category. If they're dramatically outside these bands, re-check your COGS and expense figures before assuming you've found a gold mine or a disaster.
Step 4: Find and Fix the Three Biggest Margin Leaks
The difference between gross and net margin is your operating cost burden. For ecommerce sellers, it concentrates in three areas. American Express's margin improvement guide found that "even seemingly minor cost-saving measures can significantly improve margins," including switching to reusable containers and negotiating volume discounts.
COGS Creep. Supplier prices drift upward by 3–8% annually due to raw material costs, currency fluctuations, and fuel surcharges. Review your supplier invoices quarterly against original quotes. If your per-unit cost has risen more than 5% without a corresponding price increase on your end, you've been silently losing margin for months.
Shipping Bloat. If you're paying $6.80 per package when a 2-day-slower option costs $4.20, that $2.60 difference across 1,000 orders is $2,600 in margin you're giving away for free. The real cost of speed in shipping often exceeds what operators expect until they run the per-order math.
App Subscription Overhead. The average Shopify store runs 6–8 paid apps. At $15–50/month each, that's $90–400/month in fixed costs before a single unit ships. Audit your app stack every 90 days. If an app hasn't contributed to a measurable outcome (fewer returns, higher AOV, better conversion) in the past quarter, cancel it.
Verification: Calculate the dollar impact of each leak over the trailing 30 days. Rank them by size. Fix the largest one first.
Step 5: Build Monthly Margin Tracking
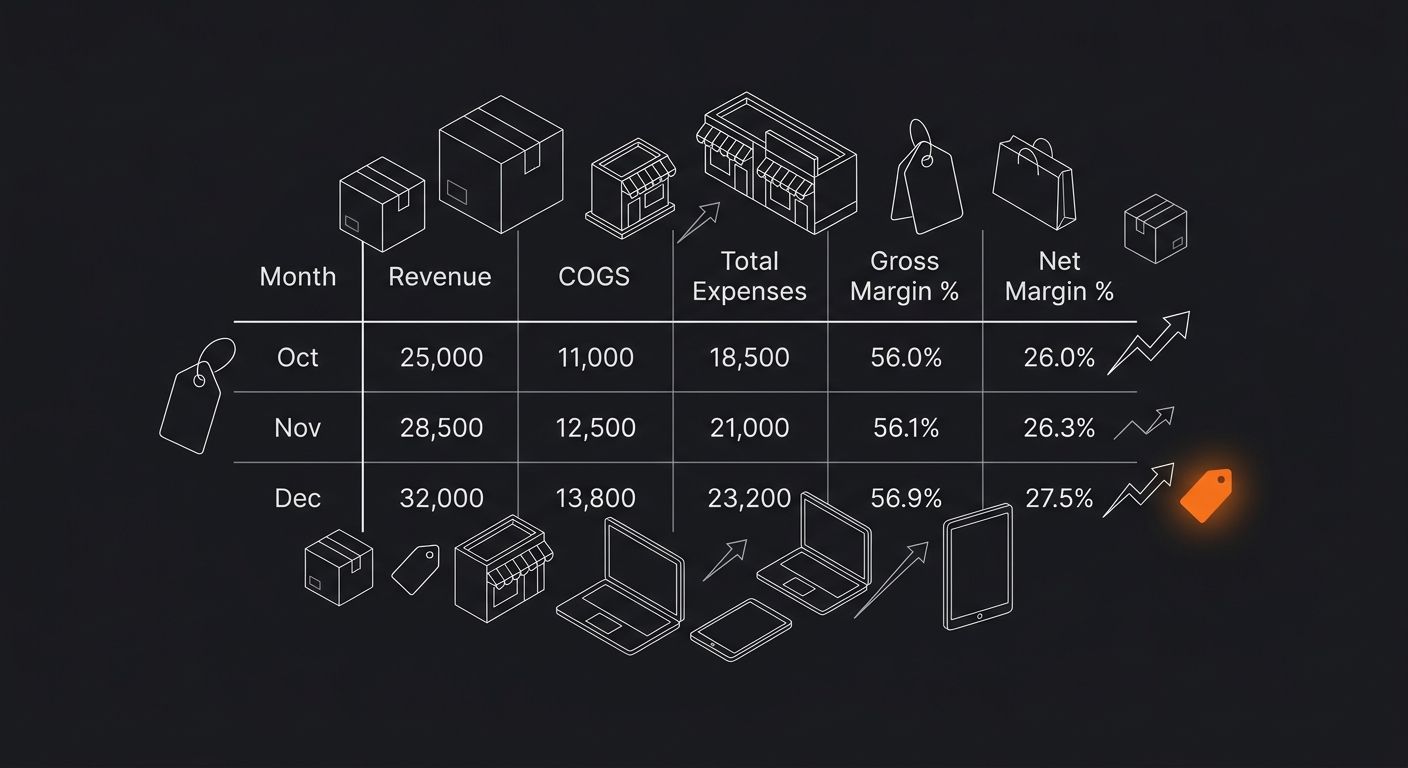
Create a single Google Sheet that auto-calculates both margins each month. You need four input columns (Month, Revenue, COGS, Total Expenses) and two formula columns (Gross Margin %, Net Margin %).
The 2026 consensus from financial advisors: review margins monthly for ecommerce and manufacturing businesses, quarterly for service businesses. Monthly reviews catch supplier price increases, shipping rate changes, and ad cost spikes before they compound across a full quarter. Track these KPIs alongside your supplier metrics so you can see whether margin shifts correlate with specific vendor performance issues.
A 1% improvement in net profit margin sounds small. On $500,000 in annual revenue, that's $5,000 in additional profit with zero incremental sales. On $2M, it's $20,000. The margin percentage is abstract. The dollar figure behind it is not.
Verification: You'll know your tracking works when you can answer this question within 60 seconds: "What was my net margin last month, and how did it compare to the month before?" If it takes longer than that, simplify your sheet.
When the Numbers Don't Add Up
Gross margin is negative. You're selling below cost. This happens when currency exchange rates shift after you've set prices, or when suppliers add fees (labeling, packaging, handling) that weren't in the original quote. Re-pull your actual per-unit landed cost including every fee and surcharge.
Gross margin looks great but net margin is under 5%. Your operating costs are too high relative to revenue. Start with your three largest non-COGS expense categories and evaluate whether each generates measurable return. Ad spend above 20% of revenue with ROAS below 3x is the most common culprit in stores I've consulted with.
Margins fluctuate wildly month to month. This usually traces to inconsistent COGS (suppliers charging different rates per batch) or seasonal ad spend variation. Normalize by calculating a 3-month rolling average instead of relying on any single month's snapshot.
Where the Numbers Take You Next
Running the profit margin formula once is a diagnostic exercise. Running it monthly turns the output into a management tool that catches problems early and reveals which operational changes actually moved your bottom line. After three months of data, patterns emerge: which product lines carry your margins, which suppliers compress them, and where your ad spend converts into profit rather than just revenue.
For a deeper walk-through of multi-SKU margin analysis, there's a step-by-step margin calculation guide that covers weighted averages across mixed product catalogs. And if your margins are solid but you're evaluating a switch from traditional dropshipping to print-on-demand, the cost structures differ enough that comparing Printful and Printify's economics is worth the time before you commit inventory or branding dollars to a new fulfillment model.

Ryan Torres
Ryan Torres is a former Amazon FBA seller turned dropshipping consultant who has generated over $2.8M in ecommerce revenue across 14 product launches. He specializes in supplier vetting, margin optimization, and scaling DTC operations for sub-$1M brands. Ryan focuses on actionable frameworks that drive measurable results for independent operators.
Frequently Asked Questions
- What is the profit margin formula?
- The profit margin formula divides profit by revenue and multiplies by 100. Gross margin uses (Revenue − COGS) / Revenue × 100, while net margin uses Net Income / Revenue × 100.
- How do I calculate gross profit margin?
- Gross profit margin is calculated using (Revenue − COGS) / Revenue × 100. For example, if you have $3,999 in revenue and $1,450 in COGS, your gross profit margin is 63.7%.
- What's the difference between gross margin and net profit margin?
- Gross margin measures profit after accounting for production costs but excludes operating expenses, while net margin accounts for all expenses including shipping, ads, apps, and transaction fees. A business might have a healthy gross margin but a much lower net margin once all costs are included.
- What are healthy profit margins for ecommerce stores?
- For ecommerce and dropshipping, healthy net margins typically range from 10% to 20%, while gross margins vary by business type—general dropshipping averages 15–45% gross and 10–15% net, while private label DTC brands average 50–70% gross and 15–25% net.
- What are the three biggest reasons ecommerce margins decline?
- The three biggest margin leaks are COGS creep (supplier prices rising 3–8% annually), shipping bloat (overpaying for speed), and app subscription overhead (average store pays $90–400/month for 6–8 paid apps).
- How often should I review my profit margins?
- The 2026 consensus recommends reviewing margins monthly for ecommerce and manufacturing businesses, as monthly reviews catch supplier price increases, shipping rate changes, and ad cost spikes before they compound.
- Why is my net margin so much lower than my gross margin?
- Operating expenses like shipping costs, ad spend, app subscriptions, transaction fees, and returns sit between gross and net margin. These expenses can reduce a 63.7% gross margin down to 13.1% or lower in actual net profit.
- What should I do if my gross margin is below 20%?
- If your gross margin is below 20% on a dropshipped product, your pricing or supplier costs need immediate attention, as this indicates you're not earning enough from each sale to cover operating expenses profitably.
Related Articles

How to Calculate Profit Margin: Step-by-Step
Profit margin measures how many cents of every revenue dollar you actually keep after costs. This guide walks you through calculating gross, operating, and net margin in under 15 minutes using real product numbers and formulas you can drop straight into a spreadsheet.

Profit Margin Calculator Guide
Multiplying your product cost by 1.30 does not give you a 30% profit margin. It gives you a 23% margin, and that seven-point gap is where thousands of ecommerce operators silently lose money every month.

How to Calculate Profit Percentage
Markup and margin produce different percentages from the same dollar amounts: a $15 cost and $20 sale price gives you 33% markup but 25% profit margin. This tutorial shows you how to calculate profit percentage at both the gross and net level, then verify your math with four free online calculators.
Explore more topics