The KPI Hierarchy: Which Metrics Actually Matter When You're Managing 5+ Suppliers
Scorecard tools from platforms like Tradogram, SourceDay, and Ramp default to equal weighting across four categories: quality, delivery, cost, and service.
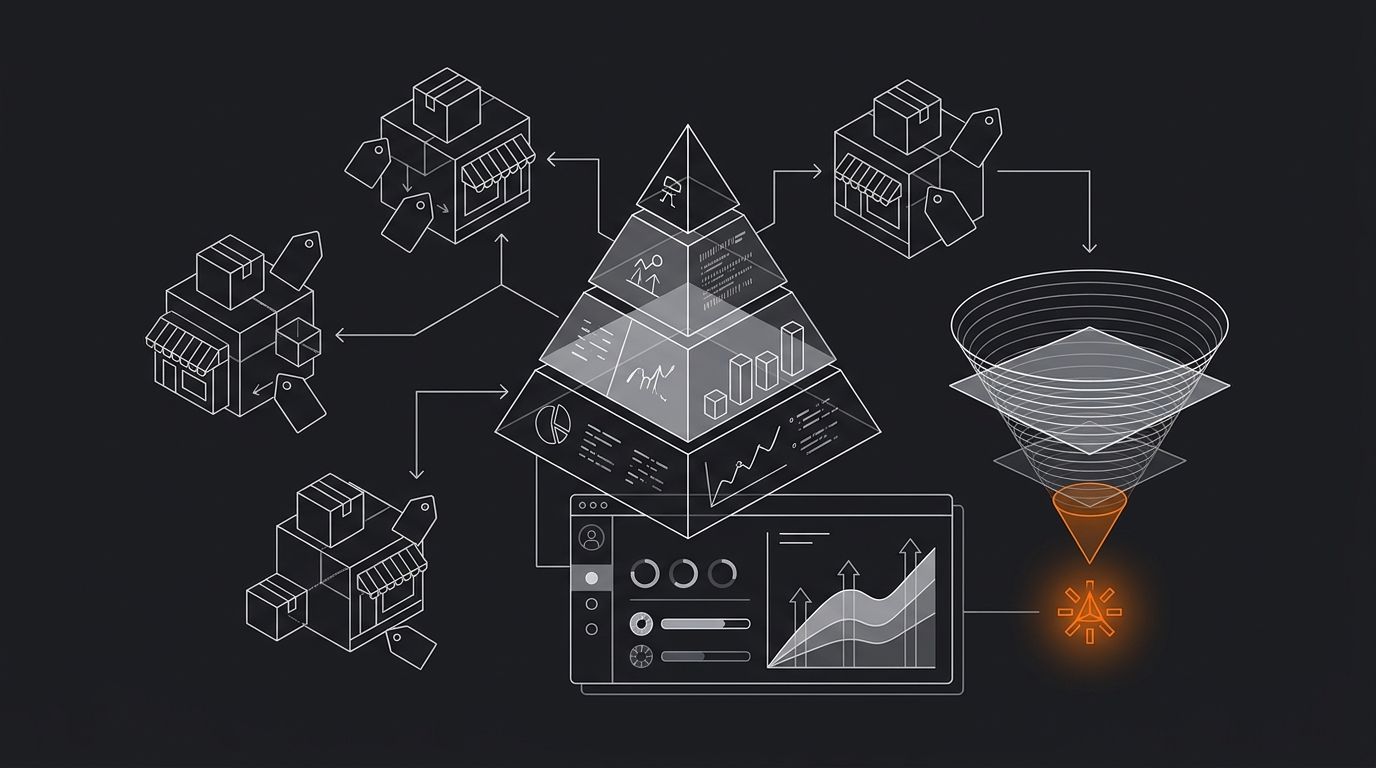
The KPI Hierarchy: Which Metrics Actually Matter When You're Managing 5+ Suppliers
Scorecard tools from platforms like Tradogram, SourceDay, and Ramp default to equal weighting across four categories: quality, delivery, cost, and service. That symmetry looks reasonable until you're running five suppliers and realize a 3% cost variance from one supplier hurts your P&L more than a two-day delivery delay from another.
Why Equal Weighting Fails at Five Suppliers
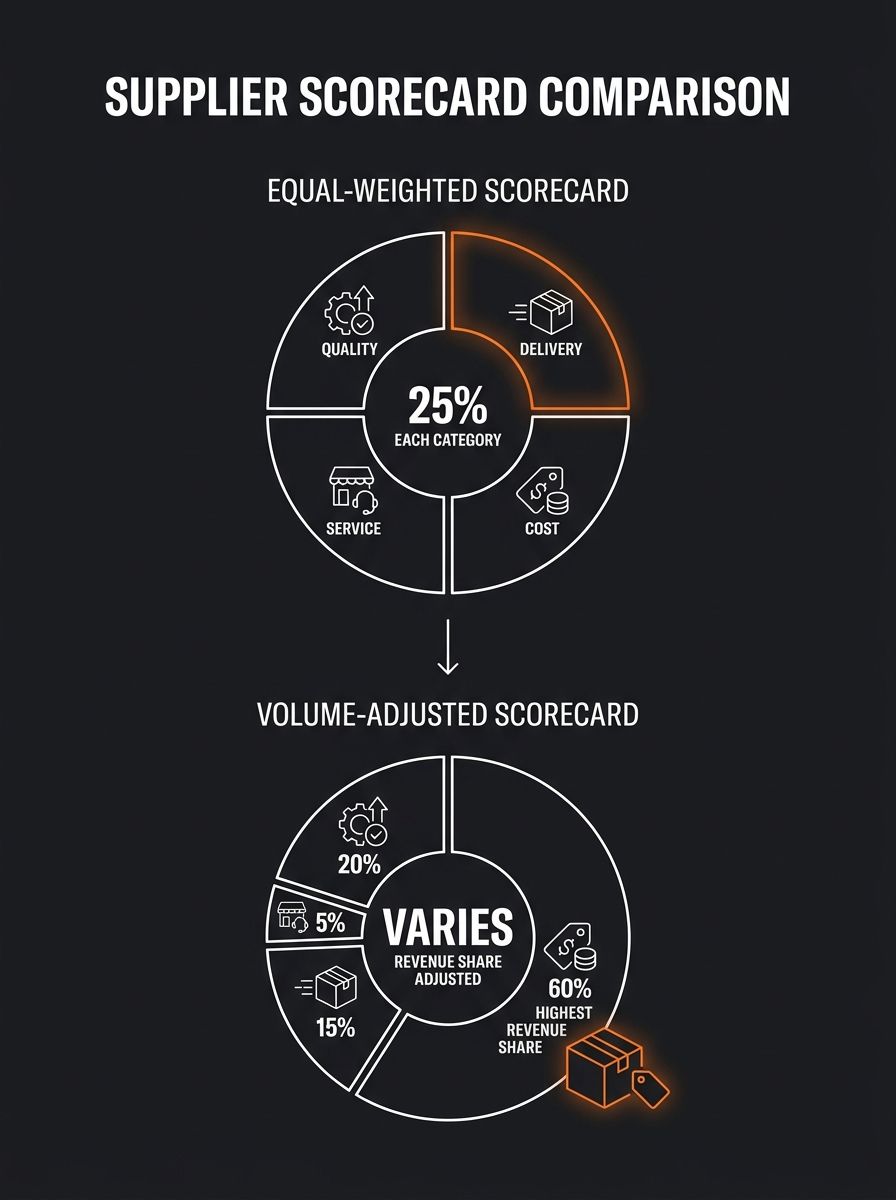
Every major supplier scorecard platform recommends the same starting framework. According to Ramp's supplier scorecard guide, the standard setup includes key performance indicators such as quality, delivery, cost, and service, with assigned weights that reflect business priorities. The problem is that the "reflect business priorities" part gets skipped. Operators import the template, assign 25% weight to each of the four pillars, and start grading. With two or three suppliers, this works well enough because you can see everything at a glance. With five or more, equal weighting buries the signal that actually matters for your margin.
Consider what happens when you run a mixed supplier stack. Say two of your five suppliers handle 60% of your order volume. Another two serve niche SKUs with higher AOV. The fifth is your backup for peak season overflow. A single scorecard template treats all five as interchangeable inputs. But the supplier responsible for 35% of your orders deserves a fundamentally different evaluation rubric than the backup supplier you use eight weeks a year. Supplier scorecard weighting has to follow revenue concentration, not a generic template.
The coordination research from PurchaserAI identifies three root causes of multi-supplier failure: "information silos, misaligned metrics, and reactive management," according to their 2026 analysis of cross-discipline supplier coordination. When your scorecard treats every supplier equally, you're creating the second problem on that list. Misaligned metrics. Your primary high-volume supplier gets evaluated on the same 25/25/25/25 split as a niche supplier doing $800 a month in revenue. That's a structural flaw in how most scorecard apps ship by default, and fixing it requires manual intervention that most operators never perform.
Cost Variance Tells You More Than On-Time Delivery
On-time delivery rate gets the most attention in every supplier performance metrics guide. Tradogram calls it "one of the most important KPIs when evaluating supplier performance," measuring the percentage of deliveries that arrive on or before the agreed-upon delivery date. And on-time delivery matters. Best-in-class suppliers hit 95%+ on-time rates, according to procurement benchmarks. But here's why on-time delivery is a lagging indicator for dropshippers rather than a leading one: by the time your delivery rate drops, customers have already filed chargebacks, left one-star reviews, and you've already spent money on replacement shipments.
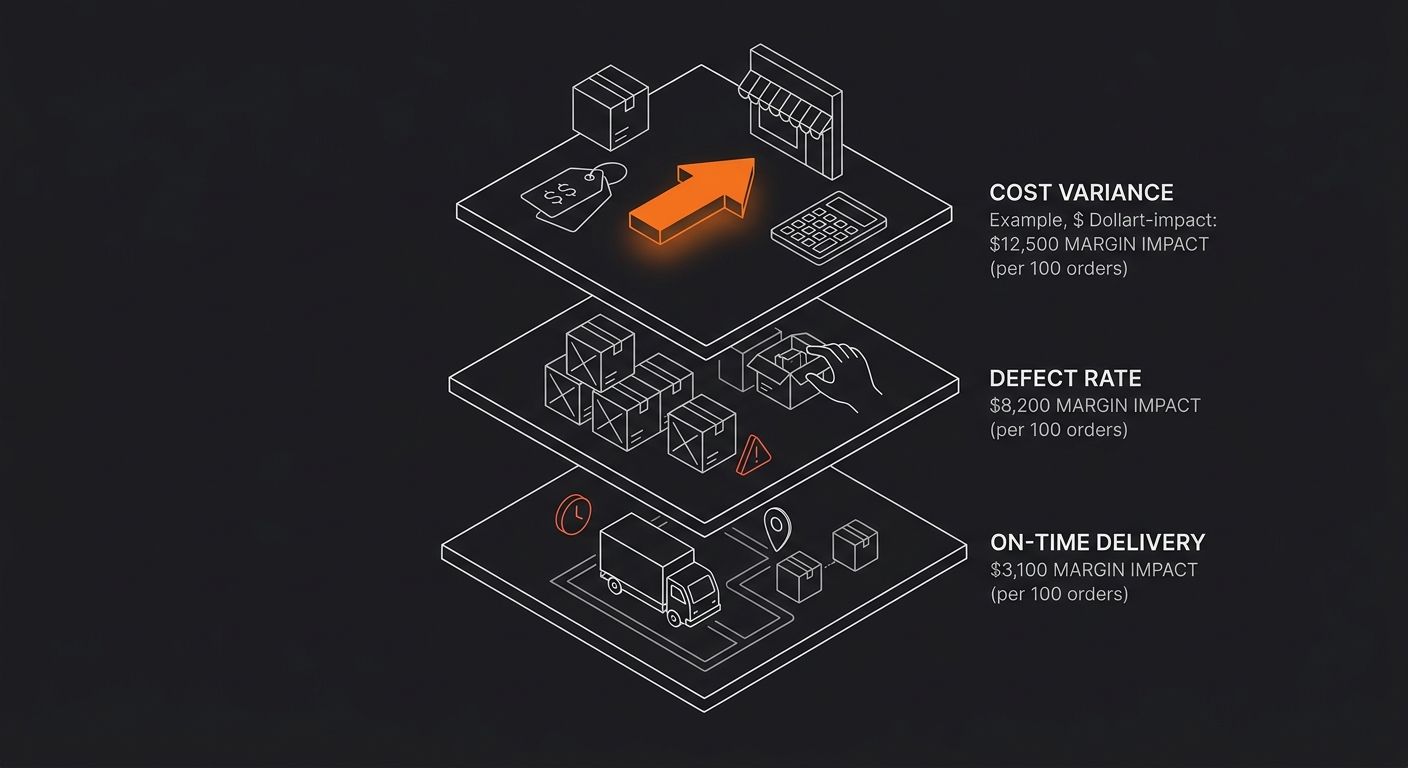
Cost variance, on the other hand, is a forward-looking metric. Veridion's supplier performance analysis defines it as "the difference between the expected cost and the actual cost of goods or services," noting that consistently higher-than-expected costs "can create real issues for your budget and profitability." If you're tracking your margins carefully (and if you aren't, a profit margin calculator breakdown is the place to start), cost variance is the first metric that moves before your overall profitability shifts. A supplier whose quoted price is $8.40 per unit but whose invoiced price creeps to $8.90 through fuel surcharges, packaging upcharges, or weight discrepancies is costing you 5.9% more than your margin math assumed. Multiply that across 400 orders a month and you've lost $200 in gross profit from a single supplier without a single late delivery.
For operators managing multi-supplier operations, the hierarchy of profitability-focused metrics should weight cost variance and defect rate above on-time delivery in most scenarios. The defect rate target for dropshipping, according to ZigPoll's KPI framework, sits under 1% of orders shipped. That 1% threshold matters because defective orders trigger returns, replacements, and customer service tickets. Each defective order can cost 2x to 3x the original product cost once you factor in return shipping, a replacement unit, and the support labor involved. If you've been through a supplier scorecard audit before, you know that defect rates tend to cluster during scaling events when suppliers take on more volume than their QC processes can handle.
How Scorecard Apps Handle Supplier Weighting
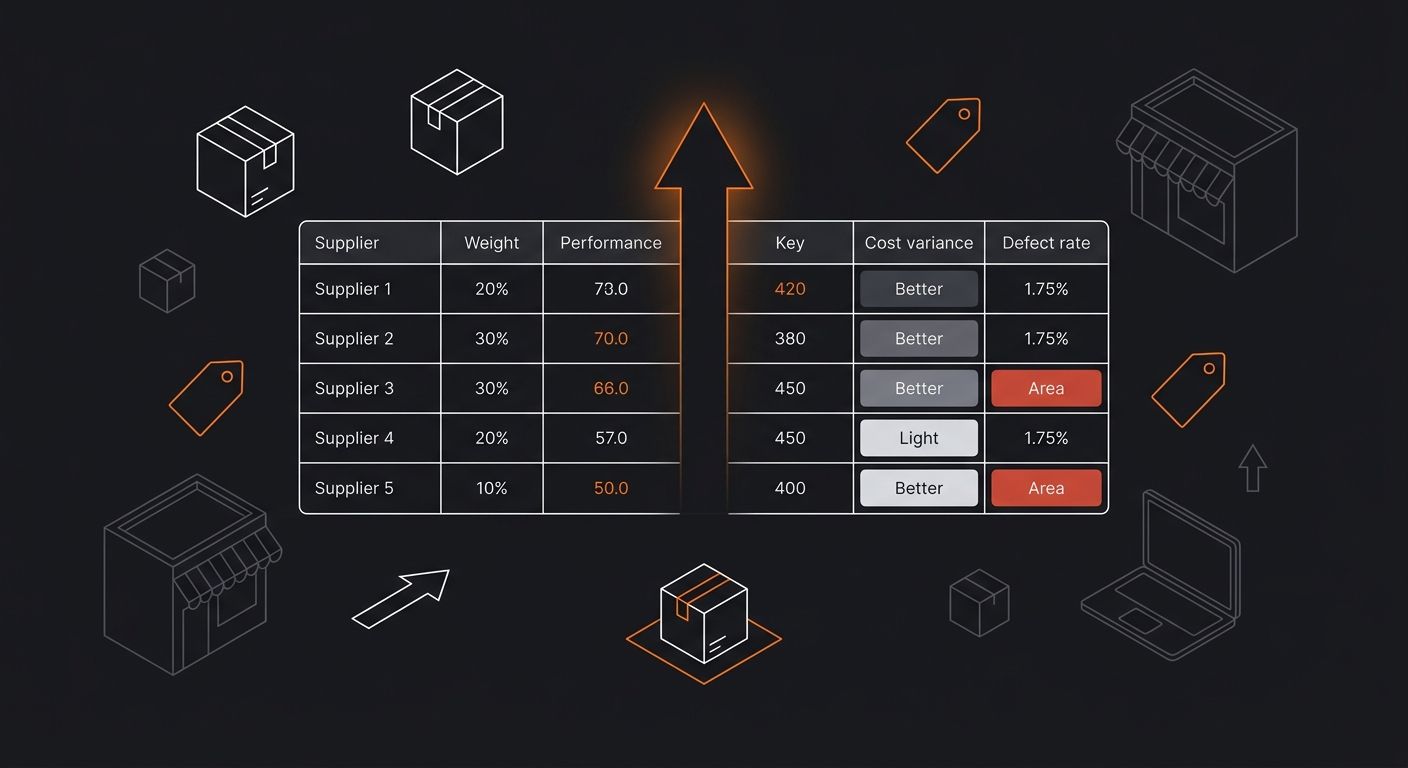
SourceDay's scorecard platform explicitly tells users to "weight each metric according to its importance to operations", which sounds like solid advice until you open the tool and realize there's no guidance on what those weights should be for different supplier tiers. The same gap exists across most supplier management tools. They give you the framework. They give you the fields. They don't tell you that your primary supplier (the one doing 40% of volume) should probably carry a 40% weight on cost variance and a 30% weight on defect rate, with delivery and service splitting the remaining 30%.
HighRadius's scorecard best-practice guide highlights a related issue: scorecards "should not be 'set and forget,'" and recommends quarterly or biannual reviews to "revisit metrics, adjust weights, and refine thresholds based on evolving business needs." That cadence matters when your supplier stack shifts. If you've rebuilt your supplier stack after a tariff shock, you've already seen how fast the old scorecard weights become irrelevant. A supplier that was your cost leader before a 15% tariff hit might now be your most expensive option, but the scorecard still shows a green checkmark from three months ago.
The EY procurement benchmark data adds another layer: 64% of chief procurement officers now tie supplier goals to enterprise sustainability targets, making sustainable spend a tracked metric alongside traditional cost and quality KPIs. For dropshippers, sustainability isn't the immediate concern, but the underlying principle applies. Your scorecard weights need to change as your business priorities change. If you're optimizing for speed and you've noticed it tanking your margins, delivery speed should move down the weighting hierarchy and cost variance should move up. If you're planning an exit and need to document supplier handoff processes, service quality and communication responsiveness suddenly become critical metrics that your scorecard probably doesn't even track.
The practical gap in dropshipping KPI prioritization is that no app automates the judgment call. Graphite Connect's supplier management guide recommends that operators "make sure each metric directly reflects your operational goals, such as reducing lead times or improving product quality." That's correct. But the operational goals for a $15K/month store with five suppliers are different from a $60K/month store with five suppliers, and the same scorecard template serves both. The weighting has to come from you, informed by which suppliers carry the most revenue risk and which metrics predict margin erosion before it shows up in your bank account.
Where the Numbers Stop Helping
There's a point in multi-supplier operations where metrics run out of explanatory power. A supplier can score 96% on-time delivery, maintain cost variance under 2%, and keep defects below 0.5%, and still be the wrong supplier for your business. Communication speed during a stockout doesn't show up on a scorecard. Willingness to negotiate on reorders during a slow month isn't a KPI. The responsiveness of a supplier's account manager when you have a packaging complaint falls outside every template Tradogram or SourceDay offers.
Ivalua's 2026 supplier performance management guide acknowledges this tension, describing the challenge of "defining clear, relevant, and measurable KPIs that align with business objectives and supplier expectations" as the core problem in SPM. The word "measurable" is doing a lot of work in that sentence. The metrics that are easy to measure (delivery dates, invoice totals, defect counts) are the ones every app tracks. The metrics that predict whether a supplier relationship will survive your next scaling push or tariff change are qualitative, subjective, and hard to put in a spreadsheet column.
So what does a weighted scorecard actually give you when you're managing five or more suppliers? It gives you a structured way to fire the bottom performer and a defensible rationale for concentrating volume with the top one. That's useful. It prevents the inertia that keeps bad suppliers in your stack for months after they should have been replaced. But the scorecard can't tell you which supplier will solve a problem at 11 PM on a Friday, or which one will silently raise prices by $0.40 a unit over three months hoping you won't notice. The numbers tell you where you've been. The judgment calls about where to go next still belong to you.
365 Dropship Editorial
Editorial team writing about E-commerce, dropshipping, and product discovery — reviews of dropshipping suppliers and platforms, trending niche guides (jewelry, beauty, pets, home, fashion), supplier due diligence, ecom operations, shipping & fulfillment strategy, product research, AOV optimization, and profitable dropshipping case studies.
Related Articles

The Supplier Scorecard Audit: Building a Quality Matrix That Catches Red Flags Before Your First 100 Orders
Procurement scoring frameworks use a 0-100 scale where any supplier below 60 earns "red" status, meaning business on hold and corrective action required.

The Customer Experience Audit: Mining Your Reviews for Operational Blind Spots Before They Tank Margins
Systematic customer feedback analysis converts raw review text into supplier performance metrics that expose margin erosion weeks before your P&L registers the damage.

The Supplier Audit Trap: Why Automation Tools Hide Quality Red Flags Until Your First 100 Orders
DSers, Spocket, and Zendrop all surface supplier scores built from the same thin data: listing age, order volume, and aggregate star ratings.
Explore more topics