The Return Rate Economics Nobody Talks About: How High-Return Niches Are Silently Destroying Dropshipping Margins
Every Shopify returns management app, from Loop to AfterShip to ReturnGO, tracks refund volume.

The Return Rate Economics Nobody Talks About: How High-Return Niches Are Silently Destroying Dropshipping Margins
Every Shopify returns management app, from Loop to AfterShip to ReturnGO, tracks refund volume. None calculate the per-order margin burden that makes apparel's 25% return rate a store-killer while jewelry's 3-5% rate preserves profit, a blind spot that costs operators 10-20% of their margins per order cycle.
The Per-Order Return Burden That Doesn't Appear on Any Dashboard
Why does a 25% return rate destroy a 40% gross margin? Because the cost of processing each return spreads across every order in the batch, dragging down the effective margin on units that were never returned. This "return burden per order" is the metric that matters, and no standard Shopify returns app surfaces it.
The math works like this. Take a $50 T-shirt with a 20% dropshipping return rate and a $10 per-return processing cost (return shipping label, customer service time, refund transaction fee). As Spocket's cost analysis illustrates, the return burden is $2 per order. That $2 hits every order in the cohort, whether the customer kept the shirt or not, because you're amortizing return costs across total revenue.
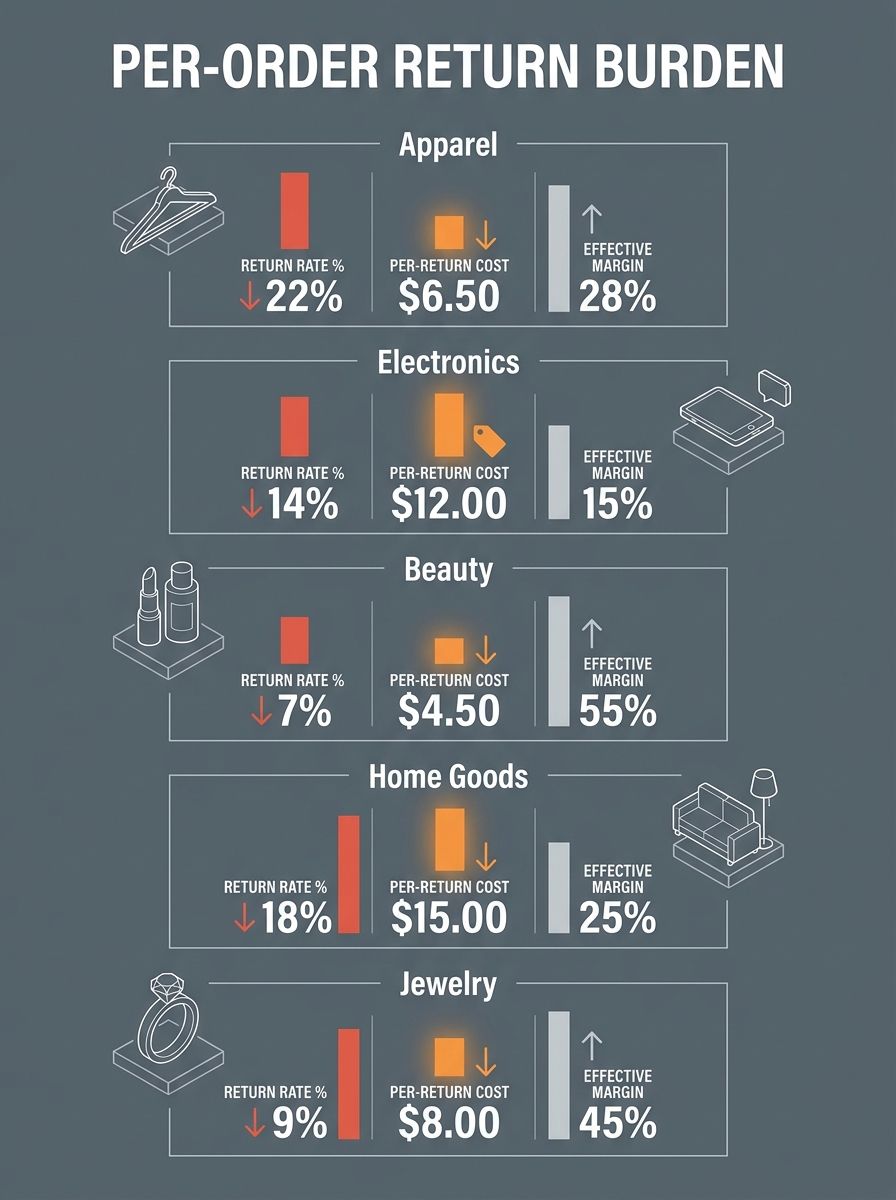
Scale that to apparel's real-world numbers and the picture gets worse. According to Eightx's 2026 ecommerce return data, apparel averages a 25% return rate. Electronics sits at 11%. Beauty lands at 12%. Home goods hits 19%. Supplements clock in at 7%. Pet products average 10%. The overall DTC ecommerce return rate has climbed to 14%, up from 11% in 2020.
A side-by-side comparison from Branvas's category research makes the margin destruction visible. An $85 dress with a 40% gross margin and a 28% return rate, factoring in a $12 return processing cost, produces an effective margin that's gutted by the time the returns cycle completes. Meanwhile, a $45 necklace with a 55% gross margin dropshipping rate, a 4% return rate, and a $3 return processing cost keeps nearly all of its profit intact. The dress generates more revenue per unit. The necklace generates more profit per unit. And the gap widens with volume.
Here's where niche selection connects directly to the returns app on your Shopify store. If your analytics are showing a healthy 40% gross margin in apparel, you're looking at the wrong number. After a 25% return rate with $10-$12 per-return costs, your effective margin is closer to 30-32%. For stores that need a 40-50% gross margin just to cover paid-traffic CAC, that gap is the difference between scaling and slow death. If you haven't already built a true CAC payback model, returns math will be invisible until cash flow turns negative.
What Loop Returns, AfterShip, and ReturnGO Actually Report
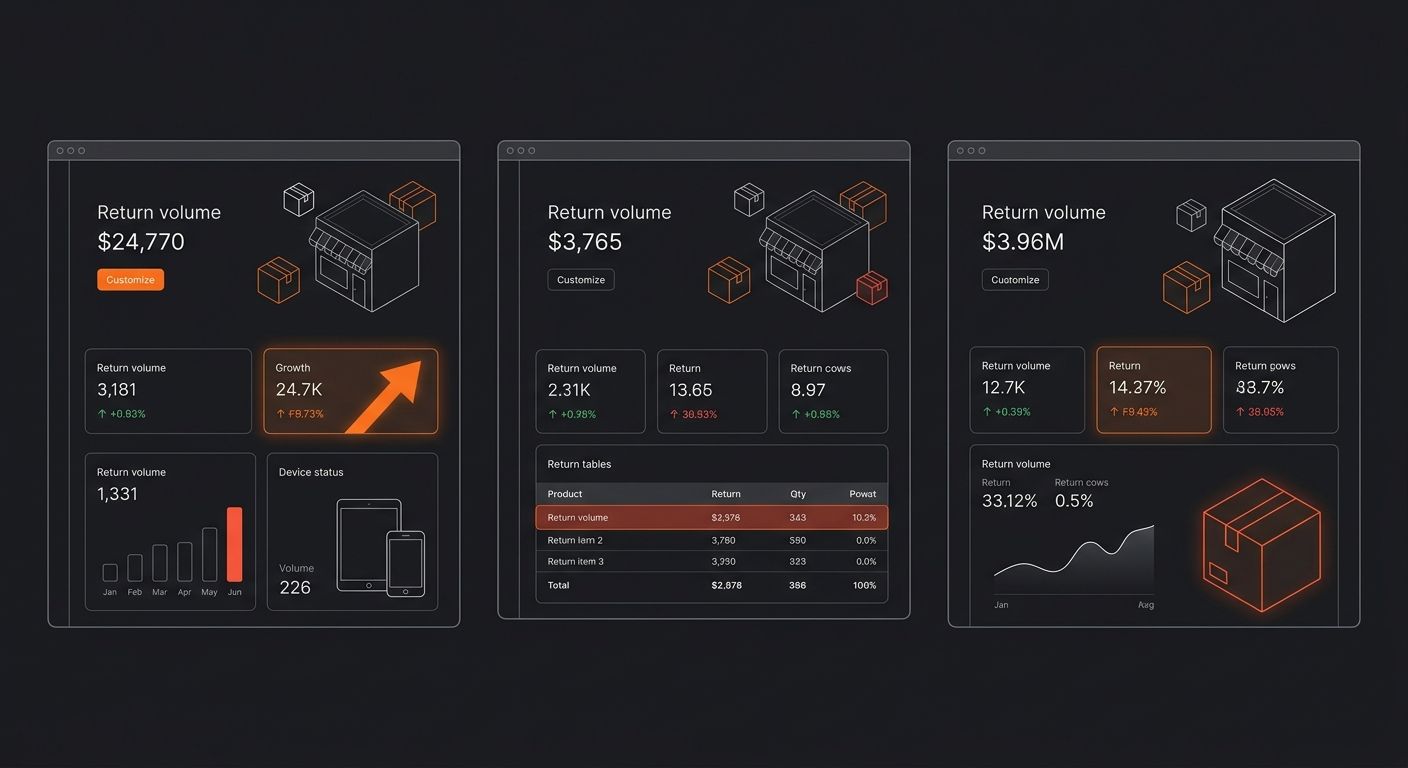
The three dominant Shopify returns management apps each handle return data differently, but they share the same blind spot: activity tracking without margin context.
Loop Returns & Exchanges (from $29/month on Shopify) focuses on converting returns into exchanges. It tracks return reasons, exchange rates, and retained revenue. The app's reporting shows you how many returns became exchanges, how much revenue you "saved," and return request volume over time. Loop is strong on reducing refund volume through exchange incentives, which is a legitimate margin-protection strategy. What it doesn't show: the per-order cost burden of the returns that do process, or how that burden scales with your category's baseline return rate.
AfterShip Returns Center (free tier available, paid from $23/month) integrates with AfterShip's tracking ecosystem. It tracks return requests, automates return label generation, and provides status updates. The reporting surfaces return volume, processing time, and return reasons. Again, no margin-layer calculation. You can see that 22% of your orders generated return requests, but you can't see what that 22% cost you per order across the entire batch.
ReturnGO (from $9.97/month) offers the most granular return reason analytics and supports partial returns and store credit. Its dashboard tracks return rates by product, by reason, and by time period. The reporting is more detailed than Loop or AfterShip on the "why" of returns, which helps with product quality decisions. But it still stops at volume metrics. No per-order cost calculation. No margin impact figure.
Feature | Loop Returns | AfterShip Returns | ReturnGO |
|---|---|---|---|
Return volume tracking | Yes | Yes | Yes |
Return reason analytics | Basic | Basic | Detailed |
Exchange conversion | Strong | Moderate | Moderate |
Per-order margin impact | No | No | No |
Return cost calculation | No | No | No |
Product-level return rates | Limited | Limited | Yes |
Starting price (monthly) | $29 | Free / $23 | $9.97 |
The comparison tells you something important about how the returns app market thinks about its job. These tools optimize the returns experience (faster processing, more exchanges, better communication). They don't touch return rate economics because they treat returns as a customer service function, not a financial one.
If you're running regular audits of your reviews for operational blind spots, you're already doing part of the work. But review mining catches quality issues that cause returns. It doesn't calculate what those returns cost you per order across your entire SKU catalog.
Building the Margin Layer Your Apps Won't
The gap between returns activity data and margin impact data requires a second layer of tooling. Profit analytics apps like TrueProfit ($19.95-$99.95/month) and BeProfit ($25-$150/month) get closer by pulling refund data into their margin calculations. TrueProfit's margin formula documentation explicitly includes refund rate as a variable in its profit margin calculation: Refund Rate = (Number of Refunds / Number of Orders) × 100%.
But even these analytics apps calculate refund impact as revenue lost, not as a per-order burden spread across the full order cohort. They'll tell you that $3,200 in refunds reduced your monthly revenue by 8%. They won't tell you that each order in your store carried an implicit $1.60 return cost that never appeared on any line item.
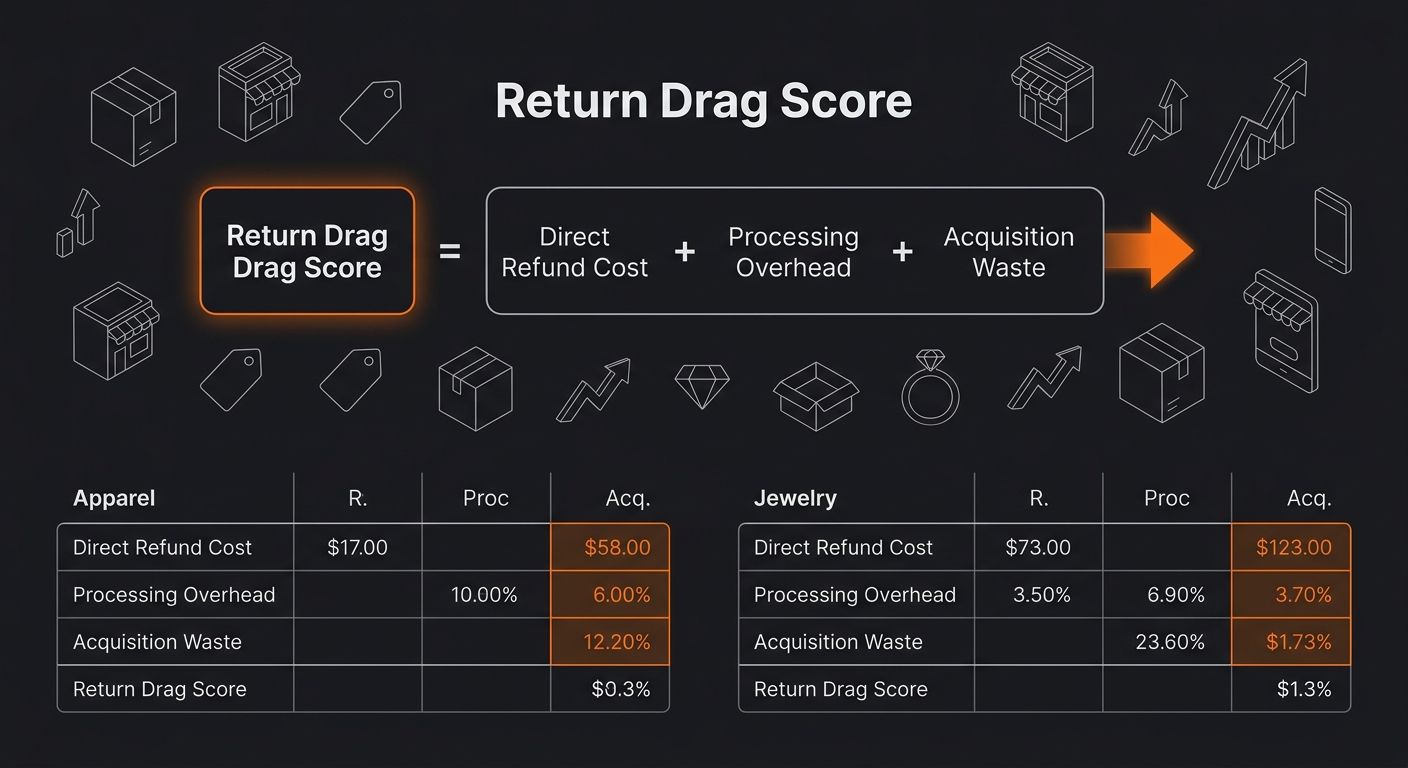
This is where you need a manual framework. I'm calling it the Return Drag Score, and it captures the three layers of cost that returns generate:
Direct refund cost: The product price + original shipping you refund to the customer. In dropshipping, this is typically the full order value since most stores offer free returns to stay competitive.
Processing overhead: Return shipping label ($4-$8 domestic via USPS, per USAdrop's logistics breakdown), customer service time ($2-$5 per ticket depending on your CS tool and response volume), app fees from your returns platform, and payment processor refund fees (Stripe keeps $0.30 per refund, for example).
Acquisition waste: The portion of your CAC spent acquiring the customer who returned. If your CAC is $18 and your return rate is 25%, you're losing $4.50 in acquisition cost per order on average to customers who never convert into retained revenue.
Return Drag Score = Return Rate × (Direct Refund Cost + Processing Overhead + CAC) per order
For the $85 apparel dress with a 28% return rate, $12 processing cost, and an $18 CAC: Return Drag = 0.28 × ($85 + $12 + $18) = $32.20 per return instance, or $9.02 spread across every order in the cohort as a per-order drag.
For the $45 jewelry necklace with a 4% return rate, $3 processing cost, and a $14 CAC: Return Drag = 0.04 × ($45 + $3 + $14) = $2.48 per return instance, or $0.10 per order.
The dress carries 90× more return drag per order than the necklace. And your returns app reports both as "processing normally."
Jewelry's real-world net margins, after acquisition costs, returns, and payment overhead, land between 10-30% according to ScaleOrder's data-driven analysis. That sounds modest until you compare it to apparel stores that show 40% gross margins on their Shopify dashboard while netting 5-12% after return drag.
The practical fix involves pairing your returns management app with a profit analytics app and then manually adding return drag as a custom cost per product category. TrueProfit allows custom cost entries per order. BeProfit supports custom expense categories. Neither automates the Return Drag Score, but both give you a place to input it so your profit dashboard reflects reality instead of optimism.
If you haven't already audited your checkout flow for margin leaks, do that first. Checkout friction causes some percentage of returns (buyer's remorse from a confusing purchase experience), and fixing that flow reduces the denominator in the entire Return Drag equation.
And if you're vetting suppliers through test orders, add a return-specific dimension: order the product, live with it for a week, and document every reason a customer would send it back. Fit issues, color discrepancies, and material quality gaps are measurable in a test order. They're expensive to discover through a 25% return rate three months into a campaign.
The Claim, Revisited
The high-return niches eating dropshipping margins will keep doing so as long as the tools operators use separate returns management from profit analytics. Loop, AfterShip, and ReturnGO are useful apps that solve the wrong problem for anyone choosing between apparel and jewelry as their next niche. They make returns smoother. They don't make returns visible as the P&L line item they actually are.
The Return Drag Score framework closes that gap with about 15 minutes of spreadsheet work per product category. Run the formula before you pick a niche, not after you've spent $5,000 on Meta ads driving traffic to a store where 25% of customers send the product back at $12 a pop. Categories below 10% return rates (jewelry at 3-5%, supplements at 7%, pet products at 10%) preserve the margins that categories above 20% silently destroy. The apps will catch up eventually. Your margins won't wait.
365 Dropship Editorial
Editorial team writing about E-commerce, dropshipping, and product discovery — reviews of dropshipping suppliers and platforms, trending niche guides (jewelry, beauty, pets, home, fashion), supplier due diligence, ecom operations, shipping & fulfillment strategy, product research, AOV optimization, and profitable dropshipping case studies.
Related Articles
The Post-Sale Audit Framework: How to Diagnose Which Dropshipping Mistakes Are Actually Costing You Margin
Theoretical margin on a $34.99 pet grooming kit sold through Shopify: 42%. Actual margin after pulling the last 100 fulfilled orders, tallying refund shipping labels, Facebook ad spend allocated per unit, and three chargebacks at $22 each: 19%.

How to Audit Your Shopify Store's Checkout Flow for Margin Leaks in Under 2 Hours
Forty-eight percent of Shopify cart abandonment traces to a single trigger: extra costs (shipping, taxes, handling fees) appearing for the first time on the payment screen, according to Baymard Institute research aggregated across dozens of ecommerce usability studies.

The Shopify App Store Is a Margin Tax: Why Most Operators Install 3x More Tools Than They Need
Eight JavaScript-heavy Shopify apps add 1-2 full seconds of page load time and produce a 7-14% conversion rate drop, according to App Store Research performance benchmarks.
Explore more topics