Why Your Product Research Is Producing Low-Margin Losers: 6 Validation Mistakes and How to Correct Them
80/20 Sourcing's product selection analysis names tool-dependent research as the top mistake that sinks ecommerce businesses before they ship a first order.

Why Your Product Research Is Producing Low-Margin Losers: 6 Validation Mistakes and How to Correct Them
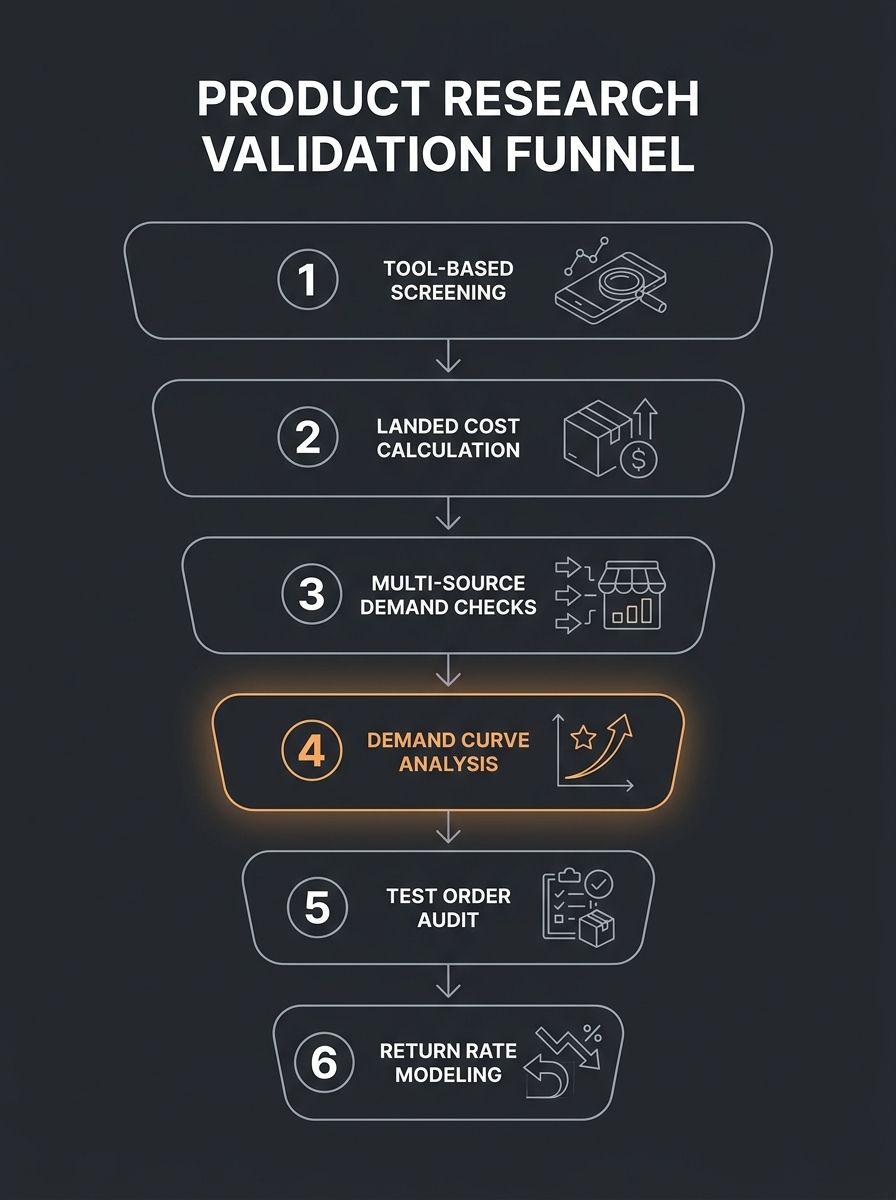
80/20 Sourcing's product selection analysis names tool-dependent research as the top mistake that sinks ecommerce businesses before they ship a first order. Six recurring product research mistakes, each tied to a specific gap in the validation workflow, consistently produce low margin products that bleed cash after launch.
Mistake 1: Treating App Output as a Green Light
ZIK Analytics publishes nine criteria for evaluating a dropshipping niche, covering competition levels, demand trends, and profit potential. The tools generating these signals handle demand and competition dimensions well but leave cost-side validation completely unaddressed. ZIK shows Amazon BSR movement. Ecomhunt highlights trending picks with estimated margins. Sell The Trend aggregates signals across TikTok, Amazon, and AliExpress. None of them calculate your actual landed cost, return exposure, or CAC payback window.
80/20 Sourcing describes the pattern directly: "One of the biggest challenges people face when starting their Private Label businesses is with PRODUCT SELECTION. More specifically how to choose profitable products AWAY from the crowds." The tool gives you what the crowd is already chasing. Following its default filters without independent validation is how niche selection failures compound into wasted ad budgets.
Your product research workflow needs a hard rule: app data is a starting filter, never the final decision. Any product that passes an initial tool screen still needs landed cost math, demand verification across multiple sources, and a test order before you commit ad spend.
Mistake 2: Running Margin Math Without Real Landed Costs
Spocket and AutoDS both display supplier prices alongside estimated shipping costs. Sellers subtract one from the other and call the remainder "margin." That calculation misses 30-40% of the actual cost stack. As we've broken down in our landed cost comparison for US-based vs. overseas fulfillment, FOB pricing on a $12 overseas product conceals $4.80 to $7.20 in additional charges across customs duties, international freight, insurance, and handling.
A product showing 45% gross margin inside AutoDS drops to 18-22% net margin once you add duties (5-25% is common for consumer goods from China, depending on HTS code), platform transaction fees (2.9% + $0.30 on Shopify Payments), and return processing costs. At 18% net margin, you need a CAC under $5.40 on a $30 product to break even on first purchase. Facebook and TikTok CPAs for cold traffic run $12-18 in competitive niches.
Mistake 3: Single-Source Demand Validation
Relying on one platform's trend data is among the most expensive dropshipping validation errors sellers make. A product trending on AliExpress might show zero organic search demand on Google. A product with strong Amazon BSR movement might face saturated ad auctions on Facebook.
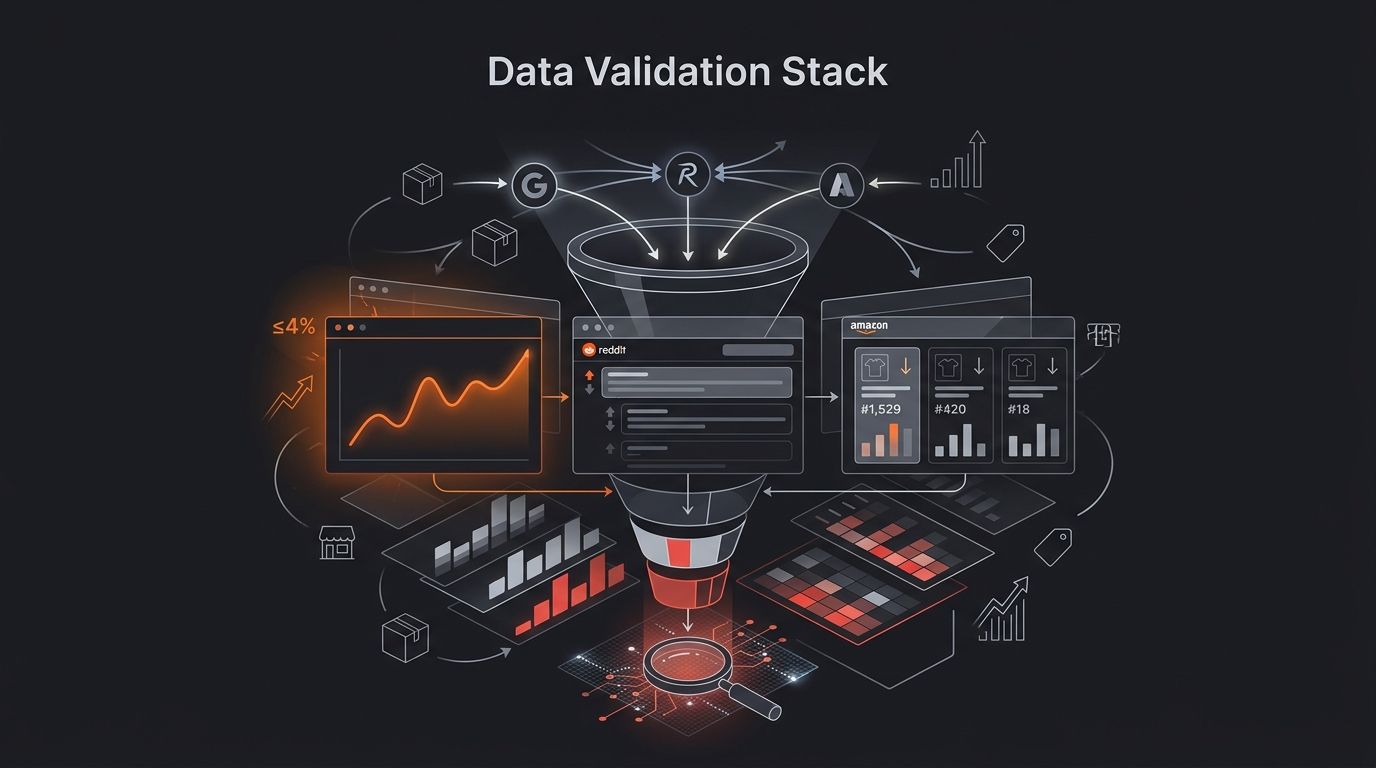
Productboard's validation framework captures this well: teams that validate across multiple signals "surface incorrect assumptions early and adjust their approach while the cost of change is still low." The same principle applies to product research. We covered this multi-tool stack in detail when explaining how to validate niche demand using Google Trends, Reddit, and Amazon BSR together. Each source answers a different question: Google Trends shows search intent trajectory, Reddit reveals real buyer pain points and objections, and Amazon BSR confirms actual purchase velocity.
The correction is straightforward. Require confirmation from at least three independent data sources before a product moves from "interesting" to "worth testing." One tool showing demand isn't validation. Three tools confirming demand from different angles starts to look like it.

Mistake 4: Ignoring Where You Are on the Demand Curve
Viral product tools like Sell The Trend and Ecomhunt surface items that are trending right now. But "right now" is often the back half of the demand curve, when early entrants have already captured margin and competition has driven ad costs up 40-60%. We've mapped this pattern across trending niches and their margin profiles, and the data is consistent: products discovered through trend-surfacing tools carry 15-25% lower net margins than products identified during early-stage demand formation.
Canny.io's product validation research reinforces why timing matters: "Product validation continues beyond the launch. Continuous feedback helps confirm if your offering still fits the market. Track these performance metrics to uncover insights: customer retention rate, CSAT, NPS, and churn rate show if customers are unhappy or leave."
The application for dropshippers is direct. A product with declining review sentiment across existing Amazon and AliExpress sellers signals late-stage demand. You're entering the market when customers are already disappointed with available options, and your version of the same product won't fix the underlying dissatisfaction driving those scores down.
What Product Research Tools Actually Cover (and What They Miss)
Why do these six niche selection failures persist? Because every major product research app covers the demand side and leaves the cost side almost entirely blank. Here's what each tool validates and where the blind spots sit:
Validation Dimension | ZIK Analytics | Ecomhunt | Sell The Trend | Spocket | AutoDS |
|---|---|---|---|---|---|
Demand/Trend Data | Yes (eBay/Amazon BSR) | Yes (curated picks) | Yes (multi-platform) | Partial | Partial |
Competition Analysis | Yes | Partial | Yes | No | No |
Landed Cost Calculation | No | No | No | Shipping estimate only | Shipping estimate only |
Return Rate Exposure | No | No | No | No | No |
Test Order Capability | No | No | No | Yes (samples) | Yes (limited) |
Demand Curve Timing | Partial (trend direction) | No | Partial (virality score) | No | No |
Every tool in this table handles demand screening reasonably well. None provides return rate data or full landed cost calculations. That blind spot is exactly where low margin products slip through undetected.
Mistake 5: Skipping the Test Order Validation Step
Qatalys' market validation research states the principle clearly: "Low friction testing beats long months of building the wrong product." The dropshipping equivalent is the test order, placed before you run a single ad dollar. Yet sellers routinely skip this step because research tools make a product "feel" validated already.
A test order reveals what no app dashboard can: actual packaging quality, real shipping times (not the 5-7 day estimates on supplier pages, but the 11-19 day reality for many Chinese suppliers), and whether the product matches its listing photos. We've documented exactly what to measure in a test order audit, and the findings are consistent across niches. Products that pass a tool screen fail test orders 25-35% of the time on packaging quality alone.
The cost of a test order runs $15-40 depending on the product. The cost of launching ads for a product with a 22% defect rate runs into the thousands through returns, chargebacks, and destroyed ad account reputation scores.
Mistake 6: Treating All Niches as Equal on Returns
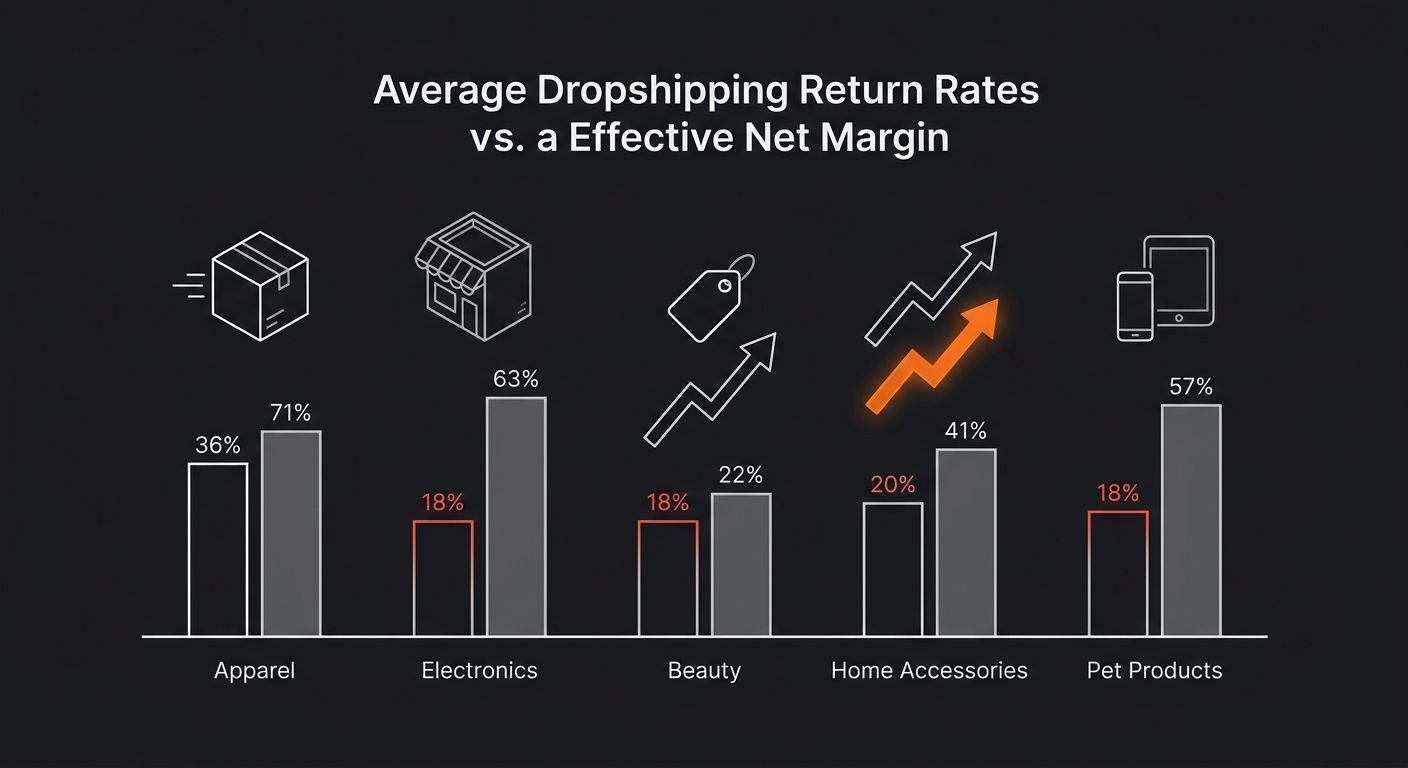
Return rates vary from 5% in home accessories to 30-40% in apparel. A product with a 35% gross margin and a 30% return rate has an effective margin closer to 10-12% after return shipping, restocking losses, and customer service time. This is one of the product research mistakes that no tool has visibility into, because return data lives in post-purchase analytics, not in pre-purchase trend databases.
The math is brutal in fashion-adjacent niches. A $35 dress with $12 COGS, $4 shipping, and a 28% return rate: your effective COGS per kept unit rises to roughly $18.50 once you absorb return losses. That's a 47% effective COGS ratio before ad spend, platform fees, or payment processing. We've published the full return rate economics breakdown by niche, and the pattern holds: sellers who don't model return rates during product research consistently end up with products that lose $2-4 per order at scale.
Questions These Metrics Still Can't Answer
The six mistakes above are correctable with better process. But the data has real limits. No research tool or validation stack can tell you whether a supplier will maintain quality at 500 units per month when they performed fine at 50. No demand curve analysis predicts regulatory changes (tariff shifts, category-specific import restrictions) that reshape unit economics overnight. And no return rate model accounts for the specific way your product photos and descriptions set customer expectations, because returns are partly a function of marketing accuracy, not product category alone.
The gap between what apps measure and what determines profit is where operator judgment still matters. Tools narrow the field. Validation steps reduce risk. But the final call on whether a product is worth your capital requires understanding the costs and dynamics that live outside any dashboard. A product research workflow that layers tool output, landed cost math, multi-source demand checks, test orders, and return rate modeling gives you the closest thing to a reliable filter for catching the six most common reasons sellers end up scaling products that were never profitable to begin with.
365 Dropship Editorial
Editorial team writing about E-commerce, dropshipping, and product discovery — reviews of dropshipping suppliers and platforms, trending niche guides (jewelry, beauty, pets, home, fashion), supplier due diligence, ecom operations, shipping & fulfillment strategy, product research, AOV optimization, and profitable dropshipping case studies.
Related Articles

When Spy Tools Become a Liability: How Competitive Intelligence Blinds You to Sustainable Niche Selection
Spy tools trained you to pick niches your competitors already validated, which means every product you launch enters a market where margins are compressing in real time.
How to Build a Niche Demand Validation Stack Using Google Trends, Reddit, and Amazon BSR Before You Source a Single Product
Novadata's 2026 Amazon BSR guide identifies subcategory rank, not main-category rank, as the actionable metric for niche competitive analysis.

What is Dropshipping: Complete Beginner's Guide
The global dropshipping market is projected to hit $537.8 billion in 2026, expanding at a 23.6% compound annual growth rate through 2032. Dropshipping is an ecommerce fulfillment model where you sell products online without purchasing or storing inventory.
Explore more topics