Margin Formula Excel
Excel's core margin formula is =(Revenue-Cost)/Revenue, applied to each SKU row and formatted as a percentage.

Margin Formula Excel: Build a Working Profit Calculator in 15 Minutes
Excel's core margin formula is =(Revenue-Cost)/Revenue, applied to each SKU row and formatted as a percentage. You can build a complete product-level profit calculator around that single formula in about 15 minutes, covering gross, operating, and net margins with conditional formatting to flag any product dropping below your target threshold.
Before You Start
You need Excel (desktop, Microsoft 365, or Google Sheets with minor syntax differences) and a list of your products with two data points per SKU: the selling price your customer pays and the cost of goods sold (COGS). COGS means your product cost plus inbound shipping. If you're pulling numbers from a supplier like AliExpress, include the landed cost per unit, not the catalog price alone.
Time required: 12-15 minutes for a catalog of up to 200 SKUs.
Knowledge level: you should know how to enter a formula in a cell and drag the fill handle. If you've ever typed =SUM(), you're qualified.
Lay Out Your Revenue and Cost Columns
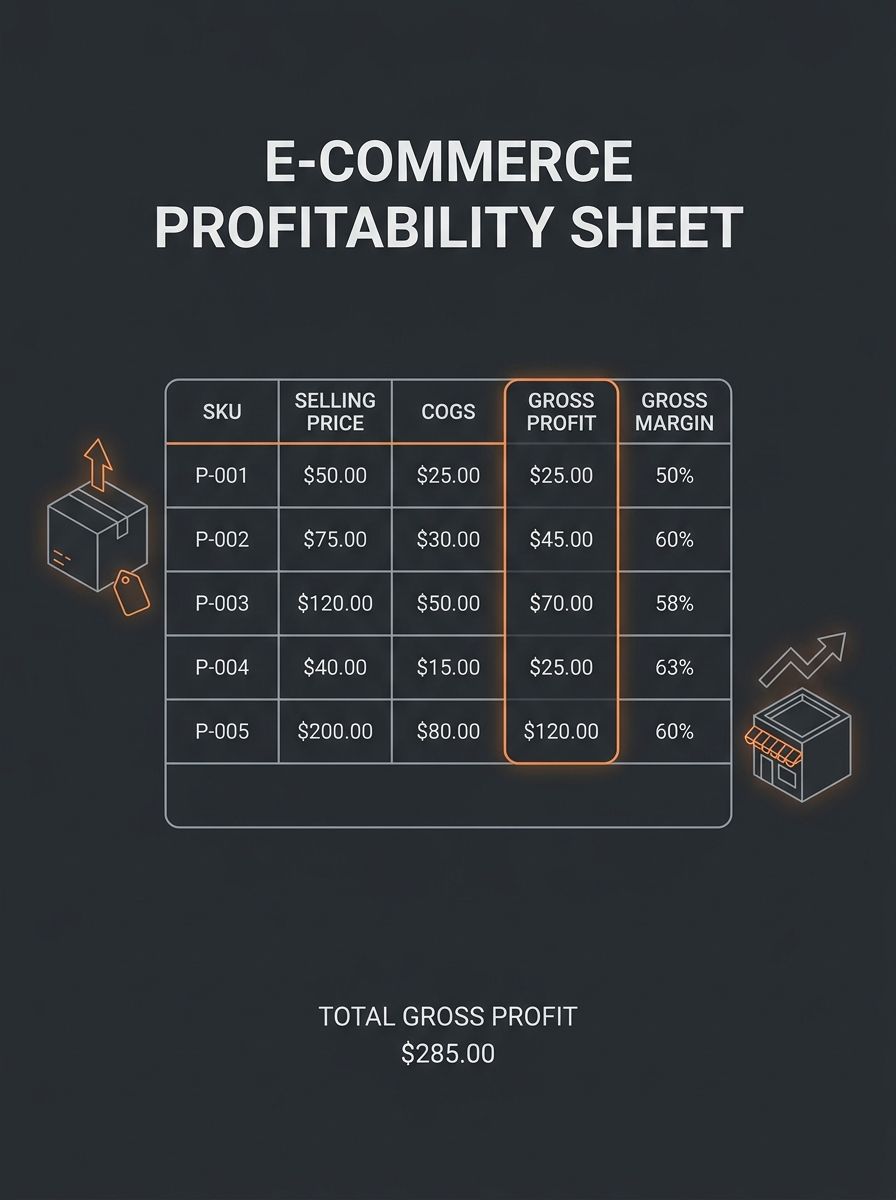
Open a blank worksheet. In row 1, create these headers:
Column | Header | What Goes Here |
|---|---|---|
A | SKU / Product Name | Your product identifier |
B | Selling Price | Price customer pays (after discounts) |
C | COGS | Product cost + inbound shipping per unit |
D | Gross Profit ($) | Calculated: B minus C |
E | Gross Margin (%) | Calculated: D divided by B |
Enter your first product in row 2. For example: Product Name in A2, 24.99 in B2, 8.50 in C2.
You'll know this step worked when you have at least 5-10 products entered with selling prices and costs filled in, and no blank cells in columns B or C for any active row.
The Gross Margin Formula
The gross margin percentage formula is the foundation of every margin analysis you'll run in Excel. According to Indeed Canada's profit margin guide, the formula is: Gross profit margin = [(revenue − cost of goods sold) / revenue] × 100.
Here's how to enter it:
Click cell D2. Type
=B2-C2and press Enter. This calculates gross profit in dollars.Click cell E2. Type
=D2/B2and press Enter. This gives you the gross margin as a decimal.Right-click cell E2, select Format Cells, choose Percentage, set decimal places to 1, and click OK.
Using the example above ($24.99 selling price, $8.50 COGS), cell D2 shows $16.49 and cell E2 shows 66.0%.
You'll know it worked when your margin percentage falls between 0% and 100% for every product. If you're seeing numbers above 100% or negative values, check whether you accidentally swapped your selling price and cost columns. A thread on Reddit's r/excel community confirms the formula simply as =(G9-H9)/G9, where G is price and H is cost. The order matters.
Operating Margin and Net Margin
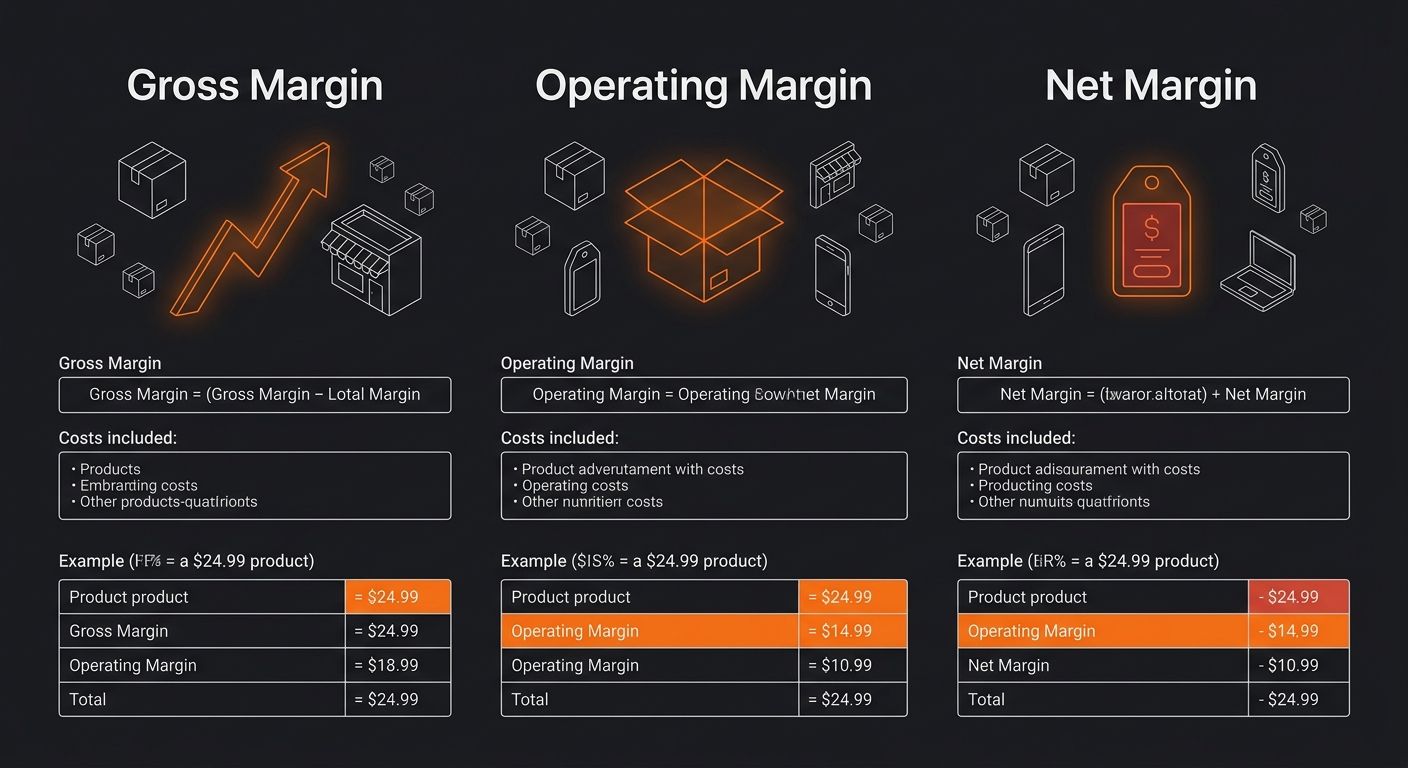
Gross margin shows product-level profitability. Operating margin and net margin show whether your business actually makes money after you pay for everything else.
Add three more columns to your spreadsheet:
Column | Header | Formula |
|---|---|---|
F | Operating Expenses per Unit | Manual entry: ad spend, platform fees, packaging |
G | Operating Profit |
|
H | Operating Margin (%) |
|
For net margin, you need one additional column:
Column | Header | Formula |
|---|---|---|
I | Net Margin (%) |
|
As Excel-Easy's profit margin tutorial explains, the operating profit is calculated first as the number above the fraction line, then divided by total revenue to get the operating profit margin percentage.
For a dropshipping product selling at $24.99 with $8.50 COGS and $6.00 in operating expenses (ads, Shopify subscription allocated per unit, payment processing at ~2.9% + $0.30), your operating margin drops to 41.9% and your net margin lands around the same figure since most dropshippers don't carry additional overhead categories beyond what's captured in operating expenses.
If you're running your store on Shopify, those platform fees add up fast across SKUs. We covered how to evaluate your full Shopify dropshipping setup costs in a separate breakdown that pairs well with this calculator.
Flag Dangerous SKUs with Conditional Formatting
A margin spreadsheet becomes useful when it screams at you about products losing money. Here's how to set that up:
Select the entire Gross Margin column (E2 through your last data row).
Go to Home → Conditional Formatting → New Rule → Format only cells that contain.
Set the condition to "Cell Value less than 0.30" (this targets anything under 30% gross margin).
Click Format, go to the Fill tab, pick red, and click OK twice.
Repeat for the Operating Margin column (H), but set the threshold at 0.15 (15%). Use orange.
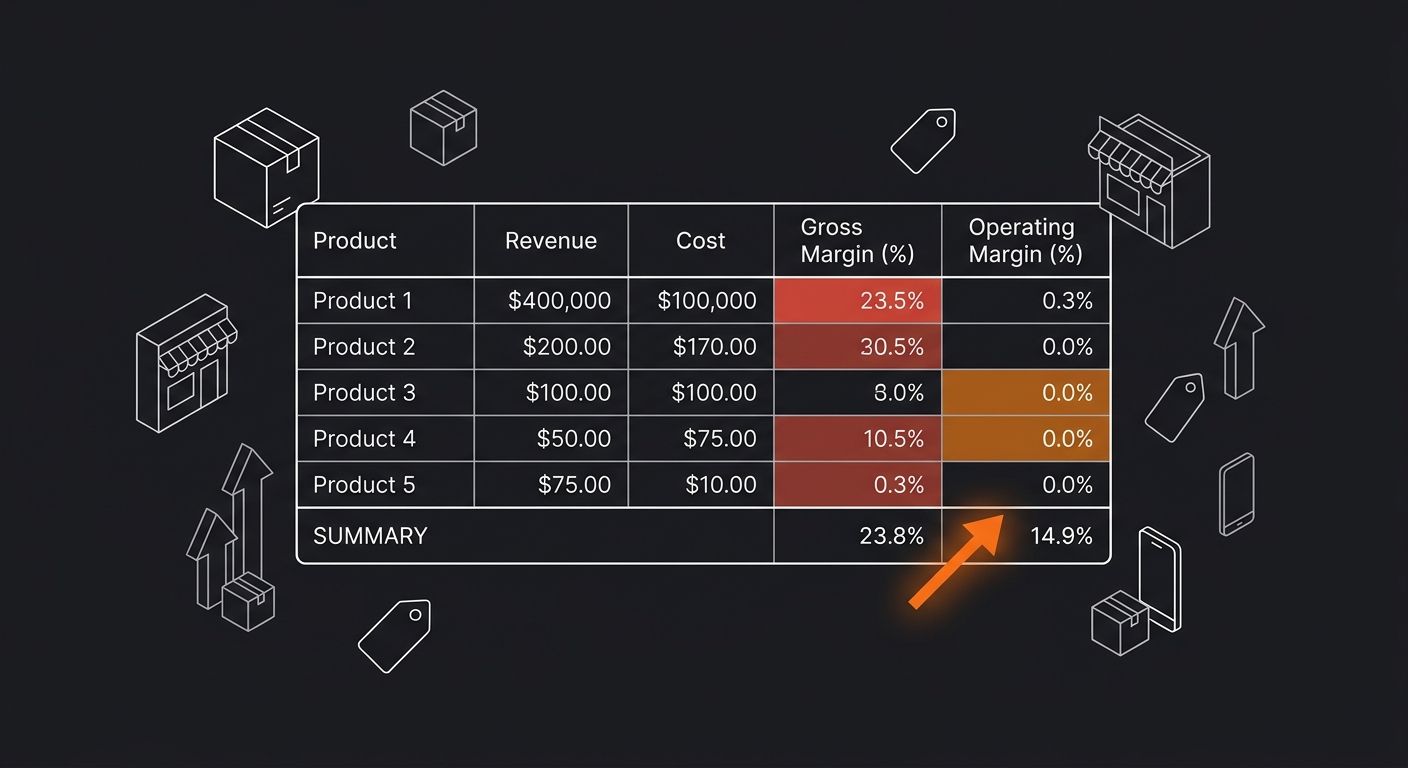
Any SKU where gross margin drops below 30% now lights up red. Operating margins below 15% turn orange. These thresholds work for most dropshipping and DTC operations. Products in the red zone need repricing, a cheaper supplier, or removal from your catalog.
If you're evaluating whether your shipping costs are eating your margins, the seven-factor shipping cost framework covers how to break down delivery expenses per unit for accurate COGS calculations.
Lock the Formula and Fill Down
With formulas working in row 2, you need to scale them across your entire product list. Select cells D2 through I2 (all your formula cells), grab the fill handle (the small square at the bottom-right corner of the selection), and drag it down to your last product row.
Excel automatically adjusts cell references. Row 3's gross profit formula becomes =B3-C3, row 4 becomes =B4-C4, and so on.
If you want a summary row at the bottom that calculates your blended margin across all products, add this in the row after your last SKU:
Total Revenue:
=SUM(B2:B200)(adjust the range to your actual last row)Total COGS:
=SUM(C2:C200)Blended Gross Margin:
=(SUM(B2:B200)-SUM(C2:C200))/SUM(B2:B200)
Format the blended margin cell as a percentage. This single number tells you your catalog-level gross margin. For context, healthy dropshipping operations typically target 30-50% gross margins at the catalog level, and anything below 20% makes it very hard to run profitably after ad spend. Our deep dive on profit margin formulas walks through how to improve that number once you know where you stand.
When the Numbers Don't Match
Three problems come up repeatedly when building margin calculators in Excel:
Problem 1: Margin and markup are reversed. A Microsoft Community Hub thread documents a user who "tried to figure out profit margins on products" and got two different percentages from two formulas. The cause: one formula divided by cost (markup), the other divided by selling price (margin). Fix: always divide by the selling price cell for margin.
Problem 2: COGS doesn't include shipping. If you enter only the supplier's product price without inbound freight, your margin looks inflated by 5-15 percentage points depending on product weight and origin. Fix: add a "Shipping Cost" column between your product cost and COGS, then make COGS a formula: =ProductCost+ShippingCost.
Problem 3: Percentage formatting confusion. If your formula returns 0.35 and you manually type 35 in another cell, Excel treats them differently. The formula result is 35% when formatted as percentage. The manually typed 35 becomes 3500% when formatted as percentage. Fix: always use formulas for calculated fields, and enter raw percentages as decimals (type 0.35, not 35).
Where to Go From Here
With a working margin formula in Excel, you've got the raw visibility to make pricing and sourcing decisions based on actual numbers. The natural next step is connecting this spreadsheet to your real order data. Export your Shopify or platform sales report as a CSV, map the columns to match your calculator layout, and update COGS monthly as supplier prices shift.
If you're selling on multiple channels, build a separate tab for each one since platform fees differ between Shopify (2.9% + $0.30 on Basic), eBay (13.25% final value fee on most categories), and Amazon (15% referral fee average). The margin formula stays the same across all of them. The cost inputs change. And once you have 60-90 days of data in the spreadsheet, you'll start spotting which SKUs deserve more ad budget and which ones need to go before they drag your blended margin into dangerous territory.

Ryan Torres
Ryan Torres is a former Amazon FBA seller turned dropshipping consultant who has generated over $2.8M in ecommerce revenue across 14 product launches. He specializes in supplier vetting, margin optimization, and scaling DTC operations for sub-$1M brands. Ryan focuses on actionable frameworks that drive measurable results for independent operators.
Frequently Asked Questions
- What is the margin formula in Excel?
- The margin formula in Excel is =(Revenue-Cost)/Revenue or =(Selling Price - Cost) / Selling Price. Set up revenue in column A, cost in column B, and the formula in column C, then format as a percentage.
- What should I include in COGS when calculating margins?
- COGS (Cost of Goods Sold) means your product cost plus inbound shipping per unit. If you're pulling numbers from a supplier like AliExpress, include the landed cost per unit, not the catalog price alone.
- What is the difference between margin and markup?
- Margin is based on the selling price and tells you what percentage of revenue you keep, while markup is based on the cost price and tells you how much you added on top of cost. A product with a $24.99 selling price and $8.50 cost has a 66% margin but a 194% markup.
- How do I highlight unprofitable products in Excel?
- Use conditional formatting to flag margins below your target threshold. Select your Gross Margin column, go to Home → Conditional Formatting → New Rule, set the condition to "Cell Value less than 0.30" (for 30% threshold), and choose a fill color like red.
- What are healthy margin targets for dropshipping?
- Healthy dropshipping operations typically target 30-50% gross margins at the catalog level, and anything below 20% makes it very hard to run profitably after ad spend.
- How do I calculate blended margin across all products?
- Add a summary row with the formula =(SUM(B2:B200)-SUM(C2:C200))/SUM(B2:B200) and format as a percentage. This single number tells you your catalog-level gross margin across all SKUs.
- How long does it take to build a margin calculator in Excel?
- You can build a complete product-level profit calculator in about 12-15 minutes for a catalog of up to 200 SKUs, covering gross, operating, and net margins.
- What should I do with SKUs that have margins below 30%?
- Products in the red zone (below 30% gross margin) need repricing, a cheaper supplier, or removal from your catalog.
Related Articles

How to Calculate Profit Margin: Step-by-Step
Profit margin measures how many cents of every revenue dollar you actually keep after costs. This guide walks you through calculating gross, operating, and net margin in under 15 minutes using real product numbers and formulas you can drop straight into a spreadsheet.

How to Calculate Profit Percentage
Markup and margin produce different percentages from the same dollar amounts: a $15 cost and $20 sale price gives you 33% markup but 25% profit margin. This tutorial shows you how to calculate profit percentage at both the gross and net level, then verify your math with four free online calculators.

Profit Margin Calculator Guide
Multiplying your product cost by 1.30 does not give you a 30% profit margin. It gives you a 23% margin, and that seven-point gap is where thousands of ecommerce operators silently lose money every month.
Explore more topics