Free vs Paid Niche Tools: The Data Quality Trade-Off That's Costing You Hidden Markets in 2026
Free niche research tools funnel every dropshipper toward identical product categories, creating the exact competitive saturation they were supposed to help you avoid.

Free vs Paid Niche Tools: The Data Quality Trade-Off That's Costing You Hidden Markets
Free niche research tools funnel every dropshipper toward identical product categories, creating the exact competitive saturation they were supposed to help you avoid.
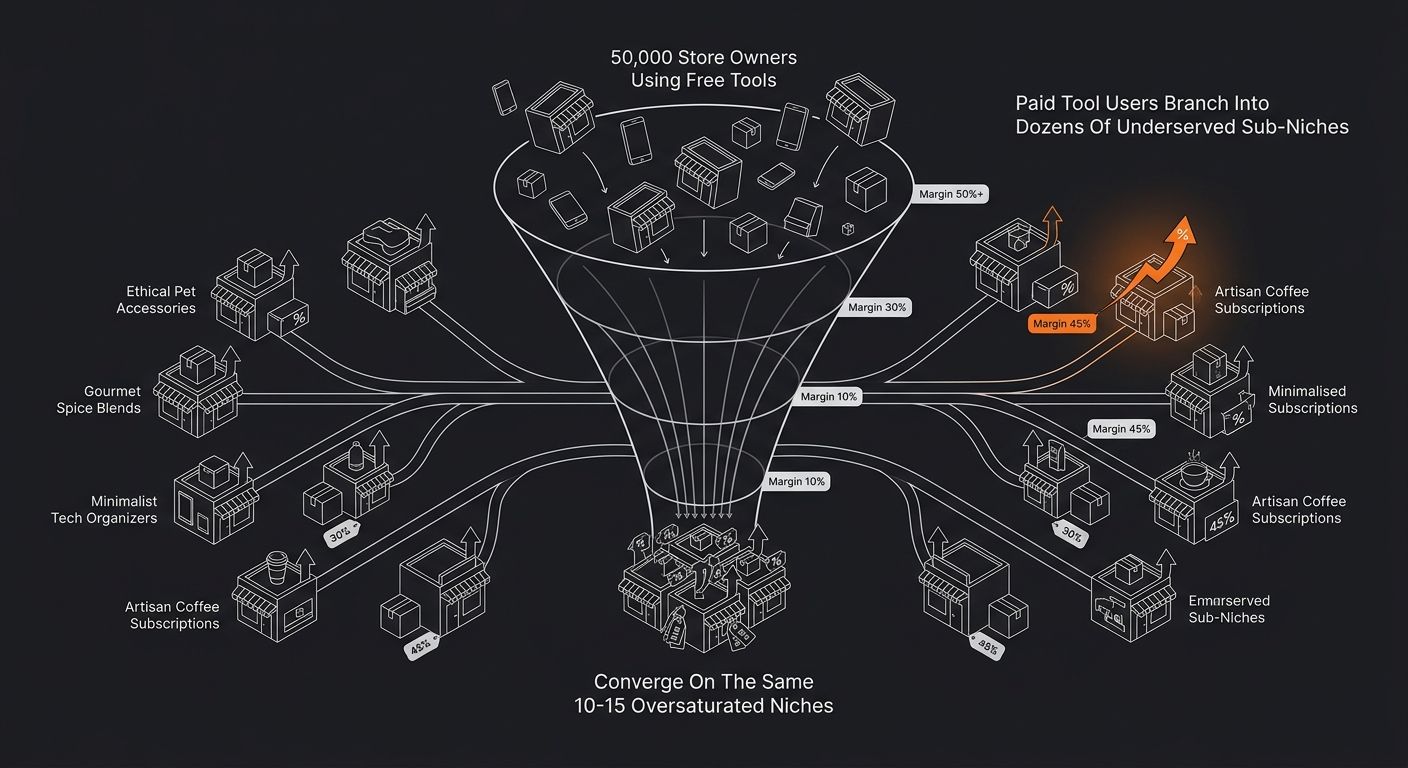
This is the central paradox of the free vs paid niche finder comparison that almost nobody talks about. When 50,000 new store owners per month run the same Google Trends query, browse the same free AliExpress bestseller lists, and plug the same seed keywords into the same zero-cost tools, they all converge on the same "winning" niches. The data isn't wrong, exactly. It's shared so widely that acting on it guarantees you're entering a market alongside thousands of operators who received the same signal at the same time.
The contrarian claim here is straightforward: your free niche tool is the single most expensive line item in your business, because the markets it can't show you are where the actual margin lives.
Three pieces of evidence support this.
The Herding Problem: Shared Data Pools Create Shared Failures
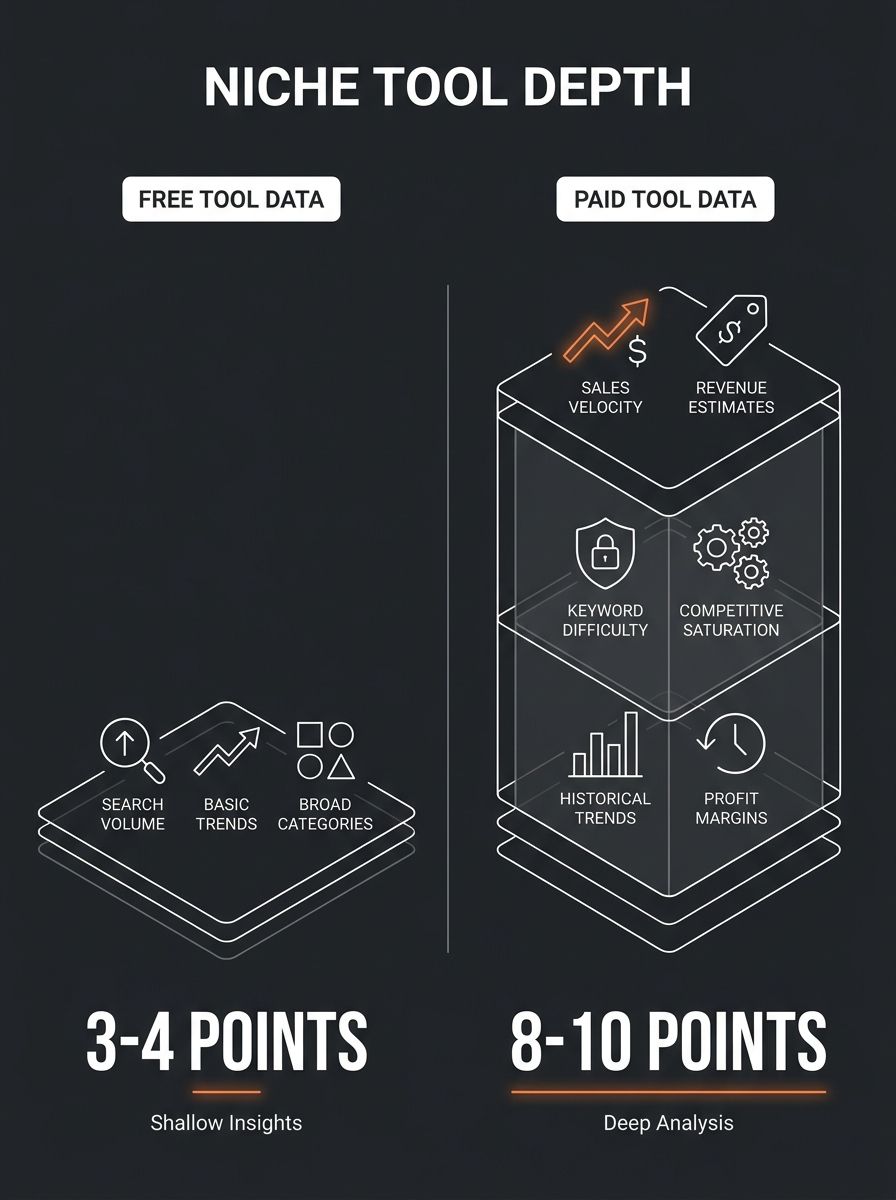
Free tools like Google Trends, Seodity's niche finder, and Superframeworks' AI-powered tool all pull from publicly available data. Google search volume. Social media trend indicators. Broad category-level demand signals. These are useful starting points, but they have a structural flaw: everyone has access to the same information at the same time.
When a free tool surfaces "pet grooming accessories" as a rising niche with low competition, that assessment was accurate the moment the data was generated. Within weeks, hundreds of stores launch targeting that exact category. The competition score the tool showed you was a snapshot, not a forecast. By the time your store is live and your first ad campaigns are running, you're bidding against a swarm of sellers who read the same free report.
Paid tools like AMZScout, Helium 10, and SEMrush create a natural filter. Their subscription cost (plans typically start under $50/month according to testing by Scribe) means fewer operators see the same data. More importantly, these tools offer granular metrics that free alternatives structurally cannot: historical sales velocity, revenue estimates per product, keyword difficulty scores calibrated against actual seller count, and competitive saturation indices.
The data quality dropshipping difference between free and paid tools isn't about accuracy in any single metric. It's about the resolution of the picture you're working from. Free tools give you a 240p view. Paid tools give you 1080p. And the niches that appear between 240p and 1080p are exactly the ones where margins are still intact.
The Margin Math That Makes Free Tools Expensive
Here's where niche research tool ROI gets concrete. Suppose you're evaluating two potential niches for a new store.
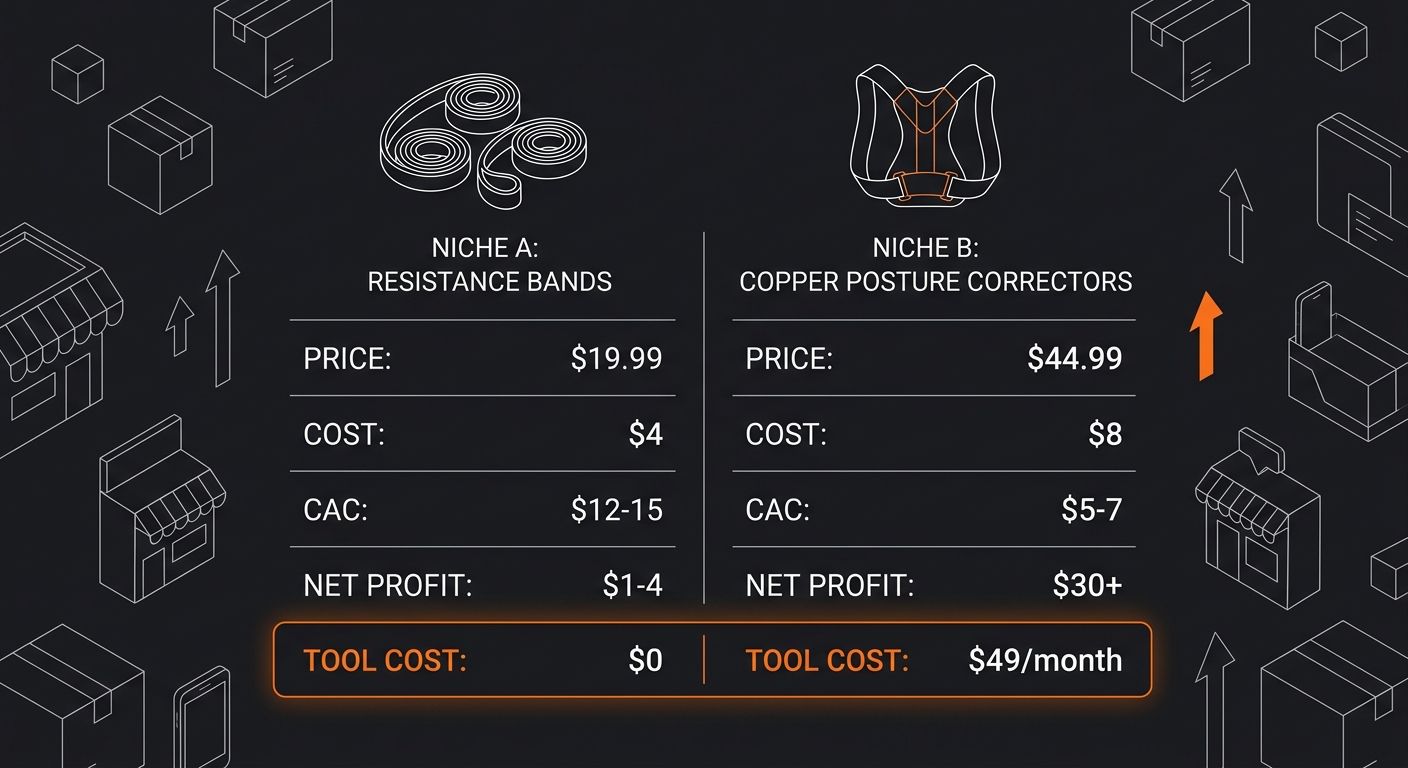
Niche A is what your free tool surfaced: resistance bands. Google Trends shows steady demand, AliExpress shows high order volume, and several TikTok hashtags are trending. Your product cost is $4, you plan to sell at $19.99, and your projected contribution margin before ad spend is $15.99 per unit.
Niche B is what a $49/month paid tool surfaced by cross-referencing Amazon sales data with keyword difficulty and seller count: therapeutic posture correctors with copper-infused fabric. Your product cost is $8, you plan to sell at $44.99, and your projected contribution margin before ad spend is $36.99 per unit.
Niche A has 2,200 competing Shopify stores. Niche B has 140.
Your CAC in Niche A, given the competition for the same TikTok and Meta audiences, runs $12–15 per acquisition. Your CAC in Niche B runs $5–7 because you're one of the few advertisers targeting that specific audience segment. After accounting for ad spend, Niche A yields $1–4 net per unit. Niche B yields $30+ net per unit.
The $49/month tool cost pays for itself on the second sale.
This lines up with what operators discover when they dig into contribution margin differences between seemingly similar products. Two products at the same price point can deliver wildly different actual profits once you account for competitive ad costs, return rates, and shipping complexity. The niche validation margin math doesn't lie, but you need sufficient data resolution to run it properly.
A retailer generally aims for a click-through rate above 2%, an add-to-cart rate around 10%, and a conversion rate of 2–3% to validate a niche as profitable. But those benchmarks assume a normal competitive environment. In oversaturated niches where every competitor found the same free data, CTRs drop below 1% and CPMs inflate because you're all targeting the same audience segments with similar creative.
Paid Tools Surface Signals That Free Tools Structurally Cannot Detect
The third piece of evidence is about what the data actually contains.
Free niche finders typically work with one or two signal types: search volume and trend direction. That's enough to tell you whether people are searching for something and whether interest is rising or falling. A sustainable niche shows steady growth or a plateau after an initial rise, while a fad shows a sharp spike followed by a drop, as noted by Online Money Spinner. Free tools can show you that curve shape, and that's genuinely useful.
But search volume tells you nothing about:
Seller density: how many stores already serve that demand
Revenue per seller: whether existing sellers are actually making money or generating volume at a loss
Keyword acquisition cost: what you'll pay in SEO effort or PPC to rank for those terms
Supply chain complexity: whether the products in that niche have quality control issues, long shipping times, or high return rates
Paid tools like Helium 10 (with 30+ features covering product research and keyword analysis) and AMZScout (which includes mentorship on niche selection) address all four of those blind spots. When you're doing a free vs paid niche finder comparison, the feature gap isn't cosmetic. Each missing data point represents a category of risk you can't assess.
And there's a subtler problem. Free tools can't show you negative signals because they don't track seller-side data. They can tell you demand exists, but they can't tell you that 80% of stores in a niche have a sub-3-star average review, indicating product quality issues that will generate returns and chargebacks. They can't tell you that the top five sellers are running at a loss to build review counts, artificially suppressing prices you'll need to compete against.
This is where data quality in dropshipping becomes a survival factor. If you're validating a niche with incomplete data, you're making a yes/no decision with maybe 40% of the relevant information. The remaining 60% only becomes visible after you've committed capital to inventory, ads, and store buildout.
Tools like Reddit, TikTok, and alternative SEO data as reverse demand indicators can supplement free tools and partially close this gap. But assembling those signals manually takes 8–15 hours per niche evaluation, which means you'll realistically evaluate 2–3 niches before committing. A paid tool lets you screen 20–30 niches in the same timeframe, dramatically improving your odds of finding the hidden market that free-tool users never see.
Where This Leaves Your Niche Selection Process
The thesis holds up under scrutiny: free niche tools are systematically more expensive than paid ones because the markets they surface are pre-saturated by the time you act on them.
This doesn't mean free tools are worthless. Google Trends, in particular, has been described by market researchers as underestimated precisely because it's free and familiar, with signals that paid tools have difficulty replicating. Trend direction and seasonality data from Google are legitimate inputs into your process.
But trend direction is table stakes. The operators who find hidden markets with real margin aren't the ones who identify that a category is growing. They're the ones who can tell you that a growing category has a specific sub-segment with 140 sellers instead of 2,200, where product costs support a $35+ contribution margin, and where advertising costs haven't been inflated by a herd of competitors chasing the same free data.
That level of resolution costs $30–80 per month depending on the tool. Given that a single well-validated niche can produce $2,000–5,000 in monthly net profit, the niche research tool ROI calculation isn't close.
If you're still building your foundational knowledge, our beginner's guide to dropshipping operations walks through how niche selection fits into the larger business model. And once you've selected a niche and need to validate your supply chain, testing suppliers with structured evaluation criteria prevents the second-most-common failure mode after bad niche selection: bad product quality.
The hidden markets are there. They're sitting in the gap between what free tools show everyone and what paid tools reveal to the operators willing to invest $50/month in better data. That gap is where your competitors aren't, and it's where your margins survive contact with reality.
365 Dropship Editorial
Editorial team writing about E-commerce, dropshipping, and product discovery — reviews of dropshipping suppliers and platforms, trending niche guides (jewelry, beauty, pets, home, fashion), supplier due diligence, ecom operations, shipping & fulfillment strategy, product research, AOV optimization, and profitable dropshipping case studies.
Explore more topics